Collected from www.thegrumble.com
Please note: These surveys are done merely for discussion and entertainment value, and should not be used as a primary planning tool. Results represent those who participated in a survey. Participants represent a very technology active part of the US framing community (forum users), but the results may not necessarily represent the industry as a whole. Please use the results with caution.
Do you have an idea for a future poll? Please email it to my attention. We're always looking for new ideas. -Mike Labbe www.getthepictureframing.com FEEDBACK FORM
12th ANNUAL TECHNOLOGY POLL- NOVEMBER 2014 157 participants 2014 RESULTS PENDING - NUMBERS BEING CRUNCHED! :)
SECTION 1: MAT CUTTING
COMPUTERIZED MAT CUTTERS (Survey of US/Canada Markets only)
2014 |
2013 |
2012 |
2011 |
2010 |
2009 |
2008 |
2007 |
2006 |
2005 |
2004 |
2003 |
|
79% |
74% |
71% |
72% |
76% |
69% |
71% |
67% |
57% |
56% |
56% |
49% |
We have a Computerized Mat Cutter (see below) |
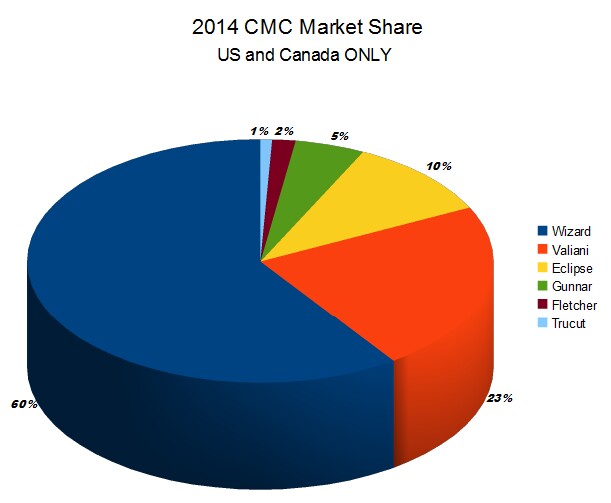
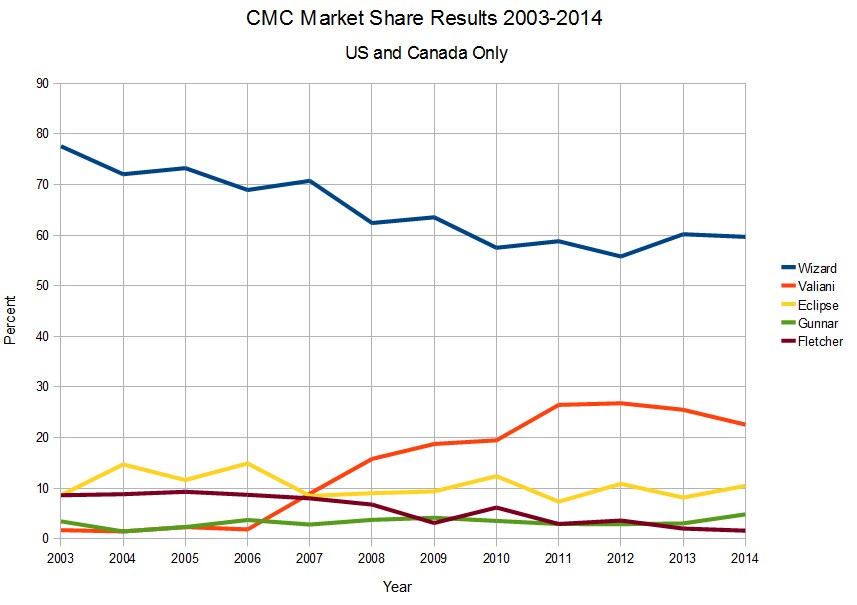
COMPUTERIZED MAT CUTTERS IN USE Comparison List (Survey of US/Canada Markets only)
2014 |
2013 |
2012 |
2011 |
2010 |
2009 |
2008 |
2007 |
2006 |
2005
|
2004 |
2003 |
|
59.68% |
60.20% |
55.80% |
58.82% |
57.52% |
63.54% |
62.41% |
70.75% |
68.94% |
73.26% |
72.06% |
77.59% |
Wizard: 5000, 8000, 8500e, 9000, etc |
22.58% |
25.51% |
26.81% |
26.47% |
19.47% |
18.75% |
15.79% |
8.94% |
1.86% |
2.33% |
1.47% |
1.72% |
Valiani: Future, Matpro, Supreme, GTO, Plus, iX, Libra, etc |
10.48% |
8.16% |
10.87% |
7.35% |
12.39% |
9.38% |
9.02% |
8.49% |
14.91% |
11.63% |
14.71% |
8.62% |
Eclipse: LT, XL, PRO (Acquired by Wizard in 1996) |
4.84% |
3.06% |
2.90% |
2.94% |
3.54% |
4.17% |
3.76% |
2.83% |
3.73% |
2.33% |
1.47% |
3.45% |
Gunnar: F1, F1-H, 601RS, 4001, 1001, 2001, 3001, Rapido, etc |
1.61% |
2.04% |
3.62% |
2.94% |
6.19% |
3.13% |
6.77% |
8.00% |
8.70% |
9.30% |
8.82% |
8.62% |
Fletcher: F6100 |
0.81% |
1.02% |
0% |
0.74% |
0% |
0% |
1.50% |
0% |
0.62% |
1.16% |
0% |
0% |
TruCut: Elan, Excel, Alpha, etc |
0% |
0% |
0% |
0.74% |
0% |
0% |
0% |
0% |
0% |
0% |
0% |
0% |
Zund: M800, M1600, L800, etc |
0% |
0% |
0% |
0% |
0.88% |
1.04% |
0.75% |
0.94% |
0.62% |
0% |
0% |
0% |
Esterly: Smart, CMC, Spirit |
0% |
0% |
0% |
0% |
0% |
0% |
0% |
0% |
0.62% |
0% |
1.47% |
0% |
Mat Maestro: |
MANUAL MATCUTTERS IN USE (US/Canada. Note: These shops may ALSO have a CMC)
2014 |
2013 |
2012 |
2011 |
2010 |
2009 |
2008 |
2007 |
2006 |
2005 |
2004 |
2003 |
|
39.49% |
43.94% |
42.86% |
52.60% |
52.94% |
52.88% |
58.11% |
59.06% |
58.95% |
58% |
61% |
n/a |
Tabletop matcutter |
12.1% |
15.15% |
20.41% |
25.32% |
21.57% |
21.15% |
14.86% |
18.11% |
17.47% |
18% |
18% |
n/a |
Wall mounted matcutter |
10.83% |
16.67% |
12.76% |
12.34% |
13.73% |
19.23% |
18.24% |
16.54% |
18.34% |
20% |
18% |
n/a |
Oval matcutter |
3.82% |
6.06% |
9.69% |
9.74% |
11.76% |
6.73% |
8.78% |
6.30% |
5.24% |
4% |
3% |
n/a |
Hand held matcutter |
OUTSIDE VENDOR FOR MATCUTTING
2014 |
2013 |
2012 |
2011 |
2010 |
2009 |
2008 |
2007 |
2006 |
2005 |
2004 |
2003 |
|
1.27% |
1.52% |
2.04% |
3.08% |
1.8% |
1.43% |
0% |
1.7% |
0.5% |
3% |
1% |
0% |
We use a matcutting service from an outside vendor |
SECTION 2: POS SYSTEMS, JOB PRICING, FRAMING VISUALIZATION TECHNOLOGY
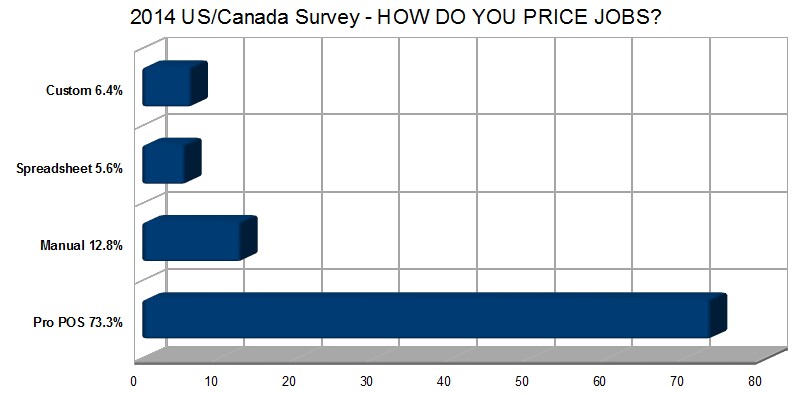
HOW DO YOU PRICE JOBS? (Survey of US/Canada Markets)
2014 |
2013 |
2012 |
2011 |
2010 |
2009 |
2008 |
2007 |
2006 |
2005 |
2004 |
2003 |
|
73.3% |
72.3% |
71.79% |
74.47% |
78.20% |
78.83% |
74.33% |
67.52% |
72.16% |
67% |
53% |
53% |
Commercial POS system (see detail below) |
12.8% |
16.42% |
17.44% |
14.36% |
11.60% |
11.85% |
11.76% |
15.29% |
15.02% |
11% |
30% |
17% |
Manually with vendor paper chart and/or calculator |
5.6% |
6.02% |
6.15% |
4.79% |
4.10% |
3.70% |
6.42% |
8.92% |
5.49% |
12% |
11% |
23% |
Spreadsheet (Excel, Calc, Lotus, etc) |
6.4% |
4.51% |
4.10% |
6.38% |
3.40% |
4.44% |
5.35% |
5.73% |
5.13% |
10% |
3% |
na |
Custom database or compiled program |
1.9% |
0.75% |
0.51% |
0% |
2.70% |
1.85% |
2.14% |
2.54% |
2.20% |
1% |
1% |
6% |
Did not answer |
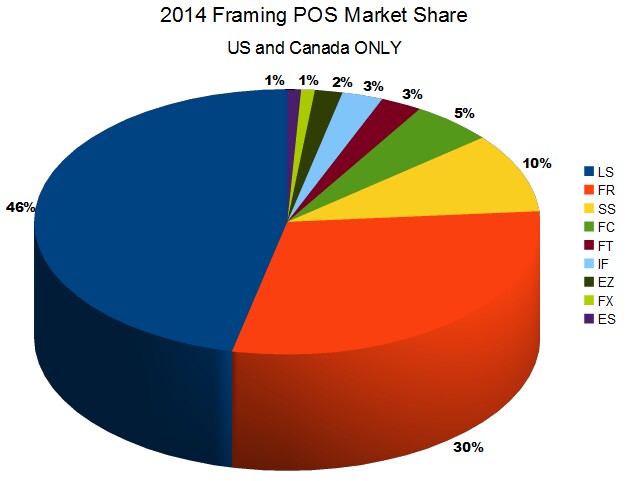
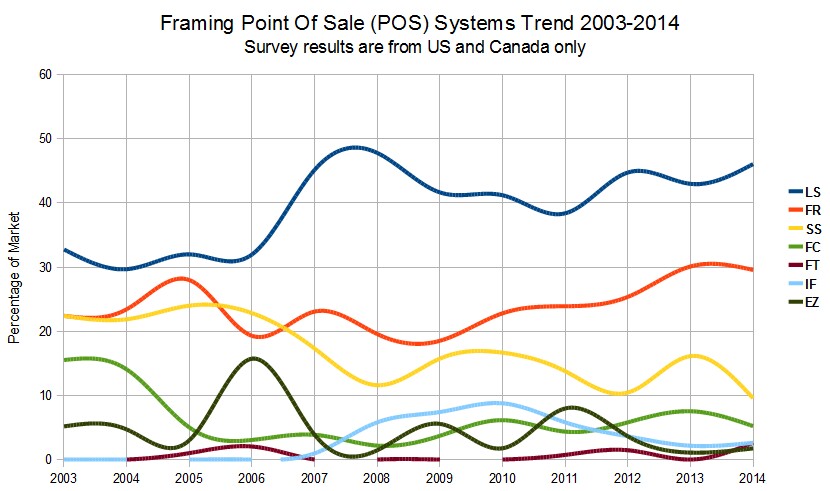
PROFESSIONAL POINT OF SALE SYSTEMS IN USE Comparison List (Survey of US/Canada Markets Only)
2014 |
2013 |
2012 |
2011 |
2010 |
2009 |
2008 |
2007 |
2006 |
2005 |
2004 |
2003 |
|
46.09% |
43.01% |
44.78% |
38.41% |
41.23% |
41.67% |
47.83% |
45.19% |
31.98% |
32.00% |
29.69% |
32.76% |
LifeSaver |
29.57% |
30.11% |
25.37% |
23.91% |
22.81% |
18.52% |
19.57% |
23.08% |
19.29% |
28.00% |
23.44% |
22.41% |
FrameReady |
9.57% |
16.13% |
10.45% |
13.77% |
16.67% |
15.74% |
11.59% |
17.31% |
22.84% |
24.00% |
21.88% |
22.41% |
SpecialtySoft |
5.22% |
7.53% |
5.80% |
4.35% |
6.14% |
3.70% |
2.17% |
3.85% |
3.05% |
5.00% |
14.06% |
15.52% |
Fullcalc |
2.61% |
0.00% |
1.45% |
0.72% |
0.00% |
0.00% |
0.00% |
0.00% |
2.03% |
1.00% |
0.00% |
0.00% |
Ferensoft Trio! |
2.61% |
2.15% |
3.62% |
5.80% |
8.77% |
7.41% |
5.80% |
0.96% |
n/a |
n/a |
n/a |
n/a |
Wizard IF Retail Management |
1.74% |
1.08% |
3.62% |
7.97% |
1.75% |
5.56% |
1.45% |
3.85% |
15.74% |
3.00% |
4.69% |
5.17% |
EZ Framer |
0.87% |
0.00% |
1.45% |
2.17% |
1.75% |
3.70% |
6.52% |
2.88% |
4.06% |
4.00% |
1.56% |
0.00% |
ESTLite |
0.87% |
0.00% |
0.00% |
0.00% |
0.00% |
0.00% |
0.00% |
0.00% |
0.00% |
0.00% |
0.00% |
0.00% |
FrameX |
0.00% |
0.00% |
0.72% |
0.72% |
n/a |
n/a |
n/a |
n/a |
n/a |
n/a |
n/a |
n/a |
IFramer |
0.00% |
0.00% |
0.72% |
0.72% |
0.00% |
0.00% |
0.00% |
0.00% |
0.00% |
0.00% |
0.00% |
0.00% |
Spinnsoft |
0.00% |
0.00% |
0.72% |
0.00% |
0.00% |
2.78% |
0.00% |
0.00% |
0.00% |
1.00% |
0.00% |
0.00% |
Custom Framer |
0.00% |
0.00% |
0.72% |
0.00% |
0.00% |
0.00% |
0.00% |
1.92% |
1.02% |
1.00% |
3.13% |
0.00% |
FrameSmart |
0.00% |
0.00% |
0.00% |
0.72% |
0.88% |
0.00% |
0.72% |
0.00% |
0.00% |
0.00% |
0.00% |
0.00% |
FrameIT |
0.00% |
0.00% |
0.00% |
0.72% |
0.00% |
0.00% |
0.00% |
0.00% |
0.00% |
0.00% |
0.00% |
0.00% |
Framer's Assistant |
0.00% |
0.00% |
0.00% |
0.00% |
0.00% |
0.93% |
0.00% |
0.00% |
0.00% |
0.00% |
0.00% |
0.00% |
Masterpiece Manager |
0.00% |
0.00% |
0.00% |
0.00% |
0.00% |
0.00% |
0.72% |
0.00% |
0.00% |
1.00% |
0.00% |
0.00% |
Artteck |
0.00% |
0.00% |
0.00% |
0.00% |
0.00% |
0.00% |
0.72% |
0.00% |
0.00% |
0.00% |
0.00% |
0.00% |
Framiac |
0.00% |
0.00% |
0.00% |
0.00% |
0.00% |
0.00% |
0.72% |
0.00% |
0.00% |
0.00% |
0.00% |
0.00% |
PFP |
0.00% |
0.00% |
0.00% |
0.00% |
0.00% |
0.00% |
0.72% |
0.00% |
0.00% |
0.00% |
0.00% |
0.00% |
Quickprice |
0.00% |
0.00% |
0.00% |
0.00% |
0.00% |
0.00% |
0.72% |
0.00% |
0.00% |
0.00% |
0.00% |
0.00% |
Wessex |
0.00% |
0.00% |
0.00% |
0.00% |
0.00% |
0.00% |
0.72% |
0.00% |
0.00% |
0.00% |
0.00% |
0.00% |
Frame&Fax |
0.00% |
0.00% |
0.00% |
0.00% |
0.00% |
0.00% |
0.00% |
0.96% |
0.00% |
1.00% |
0.00% |
0.00% |
Frame Magic |
0.00% |
0.00% |
0.00% |
0.00% |
0.00% |
0.00% |
0.00% |
0.00% |
0.00% |
0.00% |
1.56% |
1.72% |
Artisan Frame Plus |
See above comparison list link for full list of available vendors. Any not mentioned above have had 0% response for every survey year.
NUMBER OF POS WORKSTATIONS IN YOUR SHOP (Survey of US/Canada Markets)
2014 |
2013 |
2012 |
2011 |
2010 |
2009 |
2008 |
2007 |
2006 |
2005 |
2004 |
2003 |
|
56.91% |
54.08% |
60.71% |
64.14% |
56.41% |
57.27% |
56.08% |
65.79% |
66.98% |
52.68% |
52.56% |
51.39% |
One |
23.58% |
27.55% |
24.29% |
22.79% |
23.08% |
26.36% |
26.35% |
11.40% |
17.45% |
22.32% |
20.51% |
31.94% |
Two |
9.76% |
5.10% |
5.71% |
7.59% |
14.53% |
8.18% |
10.14% |
11.40% |
9.43% |
16.96% |
16.67% |
9.72% |
Three |
| 2.44% | 6.12% |
2.86% |
0.69% |
1.71% |
0.91% |
1.35% |
5.26% |
2.83% |
2.68% |
3.85% |
3.47% |
Four |
| 2.44% | 2.04% |
2.14% |
1.38% |
1.71% |
4.55% |
2.03% |
5.26% |
1.89% |
1.79% |
3.21% |
3.47% |
Five |
4.88% |
5.10% |
4.29% |
3.45% |
2.56% |
2.73% |
4.05% |
0.88% |
1.42% |
3.57% |
3.20% |
n/a |
Six or more |
POS SYSTEM BACKUPS FREQUENCY
2014 |
2013 |
2012 |
2011 |
2010 |
2009 |
2008 |
2007 |
2006 |
2005 |
2004 |
|
45.14% |
59.18% |
49.28% |
39.26% |
49.57% |
47.37% |
50.30% |
42.11% |
41.20% |
39% |
36% |
Daily backup (This is alarming- should be 100%) |
27.08% |
30.61% |
28.26% |
28.22% |
39.13% |
21.05% |
27.22% |
28.57% |
34.00% |
27% |
22% |
Weekly backup |
10.42% |
18.37% |
22.46% |
14.72% |
6.96% |
14.04% |
10.65% |
13.53% |
11.60% |
10% |
14% |
Monthly backup |
9.72% |
12.24% |
13.77% |
14.11% |
16.52% |
15.79% |
10.06% |
12.78% |
10.40% |
14% |
12% |
Once in a blue moon |
3.47% |
1.02% |
5.07% |
3.68% |
0.87% |
1.75% |
1.78% |
3.01% |
2.80% |
1% |
2% |
I DO NOT back up my data |
POS SYSTEM BACKUP METHOD
2014 |
2013 |
2012 |
2011 |
2010 |
2009 |
2008 |
2007 |
2006 |
2005 |
2004 |
|
39.13% |
38.52% |
37.68% |
40.65% |
36.14% |
38.58% |
36.27% |
36.62% |
23.79% |
20.00% |
0.00% |
I back up to USB thumb/flash drive(s) |
27.83% |
25.41% |
33.33% |
23.23% |
16.87% |
22.05% |
24.35% |
16.20% |
22.58% |
17.00% |
12.00% |
I back up to a rotation of removable hard drive(s) |
25.22% |
15.57% |
15.94% |
14.84% |
11.45% |
12.60% |
5.18% |
3.52% |
4.03% |
n/a |
n/a |
I back up to offsite co. (webrescue, carbonite, mozy, etc) |
10.43% |
7.38% |
9.42% |
7.74% |
7.83% |
11.81% |
11.40% |
9.86% |
6.85% |
12.00% |
n/a |
I back up to another pc in the same office |
8.70% |
4.10% |
5.07% |
8.39% |
6.62% |
11.02% |
17.10% |
23.94% |
34.67% |
44.00% |
46.00% |
I back up to a CD, DVD , BLU Ray, or ZIP |
7.83% |
7.38% |
5.80% |
3.87% |
3.01% |
2.36% |
6.00% |
5.63% |
2.02% |
4.00% |
6.00% |
I back up remotely via the internet to home pc |
0.87% |
1.64% |
0.72% |
1.29% |
0.60% |
0.79% |
2.07% |
2.82% |
2.42% |
4.00% |
4.00% |
I back up to a DAT or streaming cartridge/tape(s) |
0.00% |
0.00% |
0.00% |
0.00% |
0.00% |
0.79% |
0.00% |
0.70% |
3.23% |
4.00% |
7.00% |
I back up to floppy disk(s) |
0.00% |
0.00% |
5.07% |
0.00% |
0.00% |
0.00% |
0.52% |
0.70% |
0.40% |
3.00% |
3.00% |
OTHER METHOD (see voting thread) |
OFF SITE BACKUPS
2014 |
2013 |
2012 |
2011 |
2010 |
2009 |
2008 |
2007 |
2006 |
2005 |
2004 |
|
17.9% |
18.49% |
23.91% |
18.42% |
19.46% |
17.32% |
17.62% |
9.3% |
10.4% |
24% |
29% |
I store physical backups off-site in case of fire or theft |
DO YOU USE VIRTUAL FRAMING/VISUALIZATION SOFTWARE?
2014 |
2013 |
2012 |
2011 |
2010 |
2009 |
2008 |
2007 |
2006 |
2005 |
|
48.8% |
32.20% |
32.70% |
42.11% |
41.41% |
48.80% |
50.60% |
44.29% |
26.56% |
15.22% |
YES - see details below |
20.8% |
21.19% |
41.51% |
26.32% |
23.44% |
20.80% |
24.40% |
32.86% |
41.91% |
37.68% |
NO - Under consideration/maybe soon |
30.4% |
46.61% |
25.79% |
31.58% |
35.16% |
30.40% |
25.00% |
22.86% |
31.54% |
47.10% |
NO - Not considering |
VISUALIZATION SOFTWARE IN USE Comparison List (Canada/US, of those shops that use it)
2014 |
2013 |
2012 |
2011 |
2010 |
2009 |
2008 |
2007 |
2006 |
2005 |
|
36.36% |
41.94% |
34.62% |
39.58% |
35.85% |
37.70% |
38.82% |
37.10% |
n/a |
n/a |
FrameVue (LifeSaver) CAM & DB |
28.79% |
32.26% |
40.38% |
45.83% |
58.49% |
49.18% |
44.71% |
51.61% |
56.25% |
52.38% |
Integrated Framer Visualization (Wizard) CAM & DB |
10.61% |
n/a |
n/a |
n/a |
n/a |
n/a |
n/a |
n/a |
n/a |
n/a |
Bella Prisma Visualizer (Bella Moulding) |
7.58% |
3.23% |
7.69% |
0.00% |
0.00% |
0.00% |
0.00% |
0.00% |
1.56% |
4.76% |
OTHER: Non mentioned or Photoshop/InDesign |
6.06% |
12.90% |
1.92% |
4.17% |
1.89% |
3.28% |
1.18% |
1.61% |
0.00% |
n/a |
View (SpecialtySoft) DB/CAM |
4.55% |
n/a |
n/a |
n/a |
n/a |
n/a |
n/a |
n/a |
n/a |
n/a |
Larson-Juhl Interactive Designer |
3.03% |
3.23% |
5.77% |
6.25% |
0.00% |
6.56% |
1.18% |
3.23% |
0.00% |
4.76% |
Custom Framer (See-It Corporation) DB |
1.52% |
0.00% |
0.00% |
0.00% |
0.00% |
0.00% |
1.18% |
1.61% |
3.13% |
4.76% |
Artteck (Artteck Software) DB |
1.52% |
0.00% |
0.00% |
2.08% |
1.89% |
0.00% |
2.35% |
1.61% |
3.13% |
n/a |
Visualize It (FrameSmart, AU) DB |
0.00% |
6.45% |
0.00% |
0.00% |
0.00% |
0.00% |
1.18% |
3.23% |
26.56% |
33.33% |
Picture It First (Framer's Edge) CAM |
0.00% |
0.00% |
3.85% |
2.08% |
1.89% |
1.64% |
7.06% |
0.00% |
9.38% |
n/a |
Pre-View (ESTLite s/w, UK) CAM |
0.00% |
0.00% |
3.85% |
0.00% |
n/a |
n/a |
n/a |
n/a |
n/a |
n/a |
Image Framer (Apparent SW) |
0.00% |
0.00% |
1.92% |
0.00% |
n/a |
n/a |
n/a |
n/a |
n/a |
n/a |
Framing Engine (website, USA) |
| 0.00% | 0.00% | 0.00% | 0.00% | 0.00% | 1.64% | 0.00% |
0.00% |
0.00% |
0.00% |
Fullcalc |
0.00% |
0.00% |
0.00% |
0.00% |
0.00% |
0.00% |
1.18% |
0.00% |
1.56% |
4.76% |
FrameShop Pro (Visionworks) |
0.00% |
0.00% |
0.00% |
0.00% |
0.00% |
0.00% |
1.18% |
0.00% |
0.00% |
0.00% |
PFP |
SECTION 3: INTERNET ACCESS AT THE SHOP
2014 |
2013 |
2012 |
2011 |
2010 |
2009 |
2008 |
2007 |
2006 |
2005 |
2004 |
2003 |
|
97.4% |
99.2% |
98.5% |
97% |
96% |
97% |
95% |
96% |
95% |
97% |
93% |
91% |
We have internet access at the shop (see details below) |
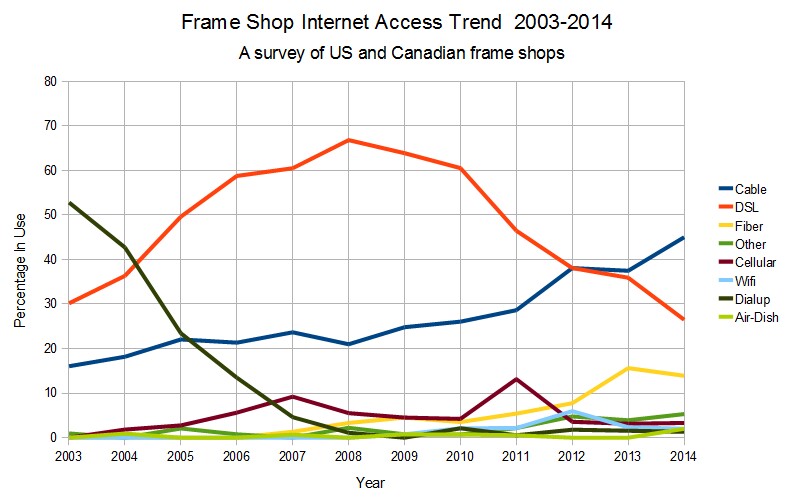
INTERNET ACCESS METHOD (US/Canada, of those shops with internet access)
2014 |
2013 |
2012 |
2011 |
2010 |
2009 |
2008 |
2007 |
2006 |
2005 |
2004 |
2003 |
|
45.03% |
37.50% |
38.10% |
28.65% |
26.06% |
24.81% |
20.99% |
23.68% |
21.35% |
22.07% |
18.18% |
16.04% |
Cable ISP |
26.49% |
35.94% |
38.10% |
46.49% |
60.56% |
63.91% |
66.85% |
60.53% |
58.80% |
49.66% |
36.36% |
30.19% |
DSL ISP (being phased out) |
13.91% |
15.63% |
7.74% |
5.41% |
3.52% |
4.51% |
3.31% |
1.32% |
0.00% |
0.00% |
n/a |
n/a |
Fiber Optic (FiOS/U-Verse, etc) |
5.30% |
3.91% |
4.76% |
2.16% |
0.70% |
0.75% |
2.21% |
0.00% |
0.75% |
2.07% |
0.00% |
0.94% |
OTHER ISP (T1, T3, Frame, ISDN, Microwave, etc) |
3.31% |
3.13% |
3.57% |
13.15% |
4.22% |
4.51% |
5.52% |
9.21% |
5.62% |
2.76% |
1.82% |
n/a |
Cellular/Mobile ISP (Verizon, ATT, TMobile, ClearWire, etc) |
1.99% |
2.34% |
5.95% |
2.16% |
2.11% |
0.75% |
0.00% |
0.00% |
0.00% |
0.00% |
0.00% |
n/a |
WIFI (from someone ELSE'S router. permission or not) |
1.32% |
1.56% |
1.79% |
0.54% |
2.11% |
0.00% |
1.10% |
4.61% |
13.48% |
23.45% |
42.73% |
52.83% |
Dialup modem ISP (obsolete) |
1.99% |
0.00% |
0.00% |
0.54% |
0.70% |
0.75% |
0.00% |
0.66% |
0.00% |
0.00% |
0.91% |
n/a |
Wireless Vendor Other ISP (DirecPC, Dish, Microwave, etc) |
SECTION 4: WEB VISIBILITY and SOCIAL NETWORKING
2014 |
2013 |
2012 |
2011 |
2010 |
2009 |
2008 |
2007 |
2006 |
2005 |
2004 |
2003 |
|
85.61% |
88.81% |
82.65% |
87.10% |
83.22% |
83.08% |
77.30% |
74.17% |
63.83% |
64.00% |
65.00% |
60.00% |
We have a web page for our shop (see details below) |
87.50% |
67.42% |
72.22% |
58.08% |
50.34% |
n/a | n/a | n/a | n/a | n/a | n/a | n/a | We have a FACEBOOK page |
29.69% |
15.91% |
19.14% |
15.66% |
13.42% |
n/a | n/a | n/a | n/a | n/a | n/a | n/a | We have a TWITTER page |
18.75% |
15.91% |
12.35% |
12.63% |
9.40% |
13.89% |
n/a | n/a | n/a | n/a | n/a | n/a | We have a COMPANY BLOG |
n/a |
0.00% |
0.62% |
n/a |
n/a |
n/a |
n/a | n/a | n/a | n/a | n/a | n/a | We have a TUMBLR page |
n/a |
0.00% |
0.62% |
n/a |
n/a |
n/a |
n/a | n/a | n/a | n/a | n/a | n/a | We have a PINTEREST page |
WHO CREATED/MAINTAINS YOUR WEBSITE?
2014 |
2013 |
2012 |
2011 |
2010 |
2009 |
2008 |
2007 |
2006 |
2005 |
2004 |
2003 |
|
43.75% |
38.66% |
32.72% |
32.10% |
39.52% |
31.48% |
30.22% |
29.29% |
38.95% |
41.11% |
35.37% |
39.71% |
A professional web designer created my site |
39.06% |
36.13% |
54.32% |
51.85% |
48.39% |
53.71% |
57.55% |
55.56% |
43.60% |
47.78% |
50.00% |
47.06% |
I designed/created the site |
15.63% |
25.21% |
12.96% |
13.58% |
12.09% |
14.81% |
12.23% |
15.15% |
17.44% |
11.11% |
14.63% |
13.24% |
A friend, employee, or relative designed/created our site |
HOW OFTEN IS YOUR WEB PAGE UPDATED OR MODIFIED?
2014 |
2013 |
2012 |
2011 |
2010 |
2009 |
2008 |
2007 |
2006 |
2005 |
2004 |
2003 |
|
4.55% |
3.36% |
4.24% |
3.09% |
0.00% |
3.70% |
2.10% |
3.54% |
2.22% |
2.04% |
2.56% |
7.25% |
Daily |
13.64% |
19.33% |
23.03% |
18.52% |
19.13% |
17.59% |
16.08% |
12.39% |
13.33% |
11.22% |
16.67% |
18.84% |
Weekly |
30.30% |
31.09% |
29.09% |
33.33% |
34.78% |
35.19% |
34.97% |
30.09% |
33.33% |
30.61% |
21.79% |
40.58% |
Monthly |
27.27% |
18.49% |
12.12% |
27.16% |
19.13% |
23.15% |
20.98% |
27.43% |
22.22% |
28.57% |
29.49% |
n/a |
Quarterly |
13.64% |
14.29% |
12.12% |
10.49% |
18.26% |
13.89% |
16.78% |
16.81% |
13.89% |
5.31% |
16.67% |
23.19% |
Yearly |
10.61% |
13.45% |
10.30% |
7.41% |
8.70% |
6.48% |
9.09% |
9.73% |
15.00% |
12.24% |
12.82% |
10.14% |
Never since initial launch |
MONTHLY COST FOR WEBHOSTING
2014 |
2013 |
2012 |
2011 |
2010 |
2009 |
2008 |
2007 |
2006 |
2005 |
2004 |
2003 |
|
1.57% |
5.26% |
4.27% |
10.19% |
7.02% |
14.15% |
13.89% |
3.33% |
0.00% |
0.00% |
0.00% |
0.00% |
Free/Third party banner ad supported |
17.32% |
14.91% |
13.41% |
21.66% |
18.42% |
16.04% |
9.72% |
20.00% |
9.66% |
10.31% |
20.29% |
n/a |
$00.01-$4.99 |
25.98% |
30.70% |
26.83% |
19.11% |
28.07% |
24.53% |
22.22% |
26.67% |
37.24% |
18.56% |
23.19% |
15.87% |
$05.00-$9.99 |
14.17% |
18.42% |
25.61% |
19.75% |
13.16% |
16.98% |
16.67% |
23.33% |
5.52% |
20.62% |
7.25% |
n/a |
$10.00-$14.99 |
7.87% |
7.02% |
7.93% |
5.73% |
7.02% |
3.77% |
6.25% |
12.22% |
25.52% |
9.28% |
20.29% |
38.1% |
$15.00-$19.99 |
7.87% |
3.51% |
3.05% |
6.37% |
4.39% |
5.66% |
5.56% |
8.89% |
0.00% |
9.28% |
7.25% |
n/a |
$20.00-$24.99 |
2.36% |
3.51% |
3.05% |
2.55% |
1.75% |
0.94% |
4.86% |
0.00% |
10.34% |
5.15% |
4.35% |
25.4% |
$25.00-$29.99 |
3.15% |
0.88% |
1.83% |
0.64% |
0.88% |
2.83% |
4.17% |
0.00% |
3.45% |
4.12% |
7.25% |
7.94% |
$30.00-$39.99 |
3.94% |
3.51% |
1.83% |
3.82% |
2.63% |
0.94% |
2.08% |
2.22% |
2.07% |
2.06% |
4.35% |
3.17% |
$40.00-$49.99 |
2.36% |
1.75% |
1.83% |
1.27% |
1.75% |
4.72% |
3.47% |
3.33% |
2.07% |
5.15% |
2.90% |
4.76% |
$50.00-$59.99 |
2.36% |
1.75% |
1.83% |
2.55% |
2.63% |
1.89% |
0.69% |
1.11% |
4.14% |
4.12% |
2.90% |
1.59% |
$60.00-$99.99 |
2.36% |
1.75% |
0.61% |
0.64% |
1.75% |
0.94% |
1.39% |
2.22% |
1.38% |
3.09% |
0.00% |
3.17% |
Over $100 |
2.36% |
1.75% |
1.83% |
1.91% |
1.75% |
0.94% |
6.25% |
10.00% |
2.76% |
n/a |
n/a |
n/a |
Included as part of franchise package |
5.51% |
3.51% |
4.27% |
1.91% |
4.39% |
4.72% |
1.39% |
6.67% |
0.00% |
0.00% |
0.00% |
0.00% |
Included as part of ISP package |
0.79% |
1.75% |
0.61% |
1.91% |
4.39% |
0.94% |
0.69% |
n/a |
n/a |
n/a |
n/a |
n/a |
In trade for services |
0.00% |
0.00% |
1.22% |
0.00% |
0.00% |
0.00% |
0.69% |
0.00% |
4.14% |
7.22% |
n/a |
n/a |
OTHER (see forum post for details) |
0.00% |
0.00% |
0.00% |
0.00% |
0.00% |
0.00% |
0.00% |
0.00% |
0.00% |
1.03% |
n/a |
n/a |
A percentage of sales |
HOW EFFECTIVE IS YOUR WEB PAGE FOR ATTRACTING CUSTOMERS ON A 1-10 SCALE?
2014 |
2013 |
2012 |
2011 |
2010 |
2009 |
2008 |
2007 |
2006 |
2005 |
2004 |
2003 |
|
4.69% |
3.33% |
6.10% |
8.43% |
8.40% |
12.28% |
10.34% |
15.83% |
23.30% |
25.77% |
33.77% |
18.84% |
1 Attracts almost NO customers on a monthly basis |
10.16% |
10.83% |
8.54% |
7.22% |
10.08% |
11.40% |
18.62% |
22.50% |
6.70% |
37.11% |
29.87% |
39.13% |
2 ** |
14.84% |
19.17% |
15.24% |
18.87% |
26.89% |
16.67% |
23.45% |
19.17% |
22.82% |
19.59% |
14.29% |
23.19% |
3 *** |
10.94% |
11.67% |
17.88% |
18.67% |
10.08% |
14.91% |
17.24% |
14.17% |
11.17% |
8.25% |
11.69% |
10.14% |
4 **** |
10.94% |
5.83% |
12.80% |
9.04% |
8.40% |
10.53% |
11.03% |
10.83% |
3.88% |
2.06% |
3.90% |
1.45% |
5 ***** |
12.50% |
18.33% |
11.59% |
16.27% |
15.97% |
15.79% |
8.97% |
9.17% |
6.31% |
5.15% |
3.90% |
0.00% |
6 Attacts about half of all new customers |
12.50% |
9.17% |
7.32% |
6.63% |
7.56% |
7.89% |
3.45% |
3.33% |
1.94% |
0.00% |
1.30% |
0.00% |
7 ******* |
14.84% |
16.67% |
14.63% |
10.24% |
4.20% |
5.26% |
4.14% |
1.67% |
2.43% |
1.03% |
1.30% |
2.90% |
8 ******** |
3.13% |
3.33% |
2.44% |
4.22% |
7.56% |
2.63% |
0.69% |
1.67% |
1.46% |
1.03% |
0.00% |
1.45% |
9 ********* |
5.47% |
1.67% |
3.66% |
2.41% |
0.84% |
2.63% |
2.07% |
1.67% |
0.00% |
0.00% |
0.00% |
2.90% |
10 Attracts almost ALL new customers |
53% |
51% |
50% |
48% |
45% |
44% |
38% |
35% |
29% |
n/a |
n/a |
n/a |
AVERAGE SCORE PER YEAR |
MISC WEB PAGE ITEMS
2014 |
2013 |
2012 |
2011 |
2010 |
2009 |
2008 |
2007 |
2006 |
2005 |
2004 |
2003 |
|
18.75% |
20.17% |
24.69% |
24.69% |
26.61% |
34.26% |
27.27% |
21.67% |
22.77% |
16% |
12% |
21.79% |
My site offers a printable coupon or promotion |
25.56% |
18.49% |
24.07% |
23.75% |
18.55% |
29.63% |
24.48% |
11.67% |
29.15% |
20% |
15% |
23.00% |
I sell a product online, through my site |
21.09% |
17.65% |
18.52% |
19.14% |
17.74% |
25.00% |
18.18% |
10.00% |
19.80% |
14% |
6% |
n/a |
I accept credit cards or paypal online |
8.59% |
7.56% |
10.49% |
11.11% |
6.45% |
12.04% |
9.79% |
10.00% |
10.45% |
11% |
12% |
n/a |
I require customers to call for web payment |
28.13% |
18.49% |
24.69% |
32.72% |
20.16% |
18.52% |
16.78% |
14.17% |
12.50% |
8% |
11% |
n/a |
I have tried paid placement/keywords on my site |
14.06% |
10.08% |
9.26% |
9.88% |
7.26% |
4.63% |
9.09% |
10.83% |
15.95% |
7% |
8% |
n/a |
I have paid to submit my site to search engines |
28.13% |
40.34% |
32.10% |
33.33% |
33.06% |
22.22% |
22.38% |
20.83% |
19.80% |
10% |
11% |
n/a |
I have attended a web marketing seminar/class |
18.75% |
26.05% |
24.07% |
30.25% |
30.65% |
37.04% |
41.26% |
23.33% |
30.80% |
21% |
17% |
n/a |
My site offers reciprocal links |
n/a |
n/a |
n/a |
n/a |
10.48% |
14.81% |
11.19% |
8.33% |
12.10% |
5% |
7% |
n/a |
My site uses flash animation/technology |
n/a |
n/a |
n/a |
n/a |
33.87% |
43.52% |
55.24% |
52.50% |
52.25% |
32% |
31% |
n/a |
My site is listed in our phone book ad(s) |
72.66% |
62.18% |
65.43% |
69.14% |
58.87% |
67.59% |
70.42% |
65.00% |
59.95% |
40% |
38% |
n/a |
My site is included in our regular ads |
25.78% |
25.21% |
24.69% |
27.78% |
25.81% |
36.11% |
27.97% |
25.83% |
18.70% |
11% |
14% |
n/a |
My site is posted on outdoor signage |
80.47% |
73.95% |
69.14% |
79.63% |
79.84% |
85.19% |
85.31% |
74.17% |
78.10% |
57% |
51% |
n/a |
My site is on our business cards |
14.06% |
20.17% |
19.14% |
21.60% |
19.35% |
29.63% |
25.87% |
15.00% |
11.55% |
n/a |
n/a |
n/a |
My site is on our company vehicle(s) |
SECTION 5: COMPUTER SECURITY
COMPUTER SECURITY: Virus, Spyware, Firewalls, etc
2014 |
2013 |
2012 |
2011 |
2010 |
2009 |
2008 |
2007 |
2006 |
2005 |
2004 |
2003 |
|
32.21% |
23.48% |
26.84% |
17.39% |
25.85% |
20.00% |
38.92% |
39.01% |
22.03% |
59% |
71% |
n/a |
Shop PC(s) have been infected in the past |
72.48% |
75.76% |
77.89% |
75.54% |
70.75% |
71.43% |
77.84% |
80.14% |
93.30% |
86% |
65% |
n/a |
We have current antivirus protection on all shop PC(s) |
8.05% |
4.55% |
6.32% |
3.80% |
9.52% |
7.86% |
5.41% |
5.67% |
6.48% |
2% |
10% |
n/a |
Our antivirus s/w subscription(s) are expired |
54.36% |
45.45% |
47.37% |
47.28% |
48.14% |
49.29% |
45.41% |
53.19% |
46.66% |
36% |
34% |
n/a |
We have a router or firewall device installed |
WIRELESS / WI-FI SECURITY
2014 |
2013 |
2012 |
2011 |
2010 |
2009 |
2008 |
2007 |
2006 |
2005 |
2004 |
2003 |
|
57.72% |
37.12% |
40.00% |
38.59% |
31.97% |
32.14% |
24.32% |
20.57% |
25.49% |
14% |
9% |
n/a |
We use wireless/wi-fi in our office |
73.26% |
95.10% |
92.11% |
97.18% |
87.23% |
91.11% |
77.78% |
89.66% |
55.93% |
50% |
54% |
n/a |
Our wireless has encryption enabled serous risk - should be 100% |
See security tips thread in the computer forum for information about securing your wireless router. If it has antennas, it needs to be secured; even if you don't USE the wireless feature personally - others may have full access. If it is not encrypted with a password/key, or if you are using WEP type encryption, your data is at risk!
SECTION 6: MISC
2014 |
2013 |
2012 |
2011 |
2010 |
2009 |
2008 |
2007 |
2006 |
2005 |
2004 |
2003 |
|
93.79% |
94.07% |
91.05% |
90.76% |
85.71% |
87.68% |
91.62% |
95.74% |
94.18% |
96% |
n/a |
n/a |
Our shop has Windows machine(s) in use |
20.38% |
20.34% |
13.68% |
15.76% |
10.88% |
10.14% |
11.35% |
12.77% |
7.98% |
9% |
n/a |
n/a |
Our shop has Apple/Mac machine(s) in use |
n/a |
11.02% |
9.47% |
15.22% |
12.93% |
18.84% |
21.62% |
26.95% |
23.96% |
26% |
30% |
n/a |
We offer a terminal for customers to search for art prints |
25.50% |
24.58% |
25.26% |
25.00% |
n/a |
n/a |
n/a |
n/a |
n/a |
n/a |
n/a |
n/a |
We offer WIDE FORMAT PRINTING |
50.34% |
52.54% |
48.42% |
49.46% |
n/a |
n/a |
n/a |
n/a |
n/a |
n/a |
n/a |
n/a |
We offer PHOTO RESTORATION. (in house or outsourced) |
48.99% |
51.69% |
45.26% |
45.11% |
41.50% |
35.51% |
36.22% |
34.75% |
26.86% |
26% |
37% |
40% |
We email some customers upon order completion |
53.02% |
55.93% |
35.79% |
36.41% |
27.21% |
29.71% |
37.30% |
37.59% |
32.67% |
32% |
n/a |
n/a |
We use online materials ordering for some vendors (LJdirect, Studio, United, LS WebOrders, etc) |
11th ANNUAL TECHNOLOGY POLL- NOVEMBER 2013 134 participants 2013
Combined with current results, at the top of this survey
10th ANNUAL TECHNOLOGY POLL- NOVEMBER 2012 196 participants 2012
Combined with current results, at the top of this survey
9th ANNUAL TECHNOLOGY POLL- NOVEMBER 2011 198 participants 2011
Combined with current results, at the top of this survey
Which BACKING PAPER do you generally use? Sep/Oct 2011, Sept 2008 (176 participants 2011, 190 participants 2008)
| 9/2011 | 9/2008 |
6/2004 |
|
38.07% |
35% |
45% |
Brown kraft paper |
32.39% |
37% |
56% |
Black kraft paper |
16.48% |
17% |
36% |
Blue Lineco/ph buffered paper |
3.98% |
03% |
06% |
Tape |
2.27% |
03% |
11% |
Tyvek |
1.14% |
01% |
02% |
Blue kraft paper |
0.57% |
01% |
00% |
Fabric. Cambrick, etc |
0% |
01% |
05% |
Decorative Paper |
2.27% |
01% |
02% |
OTHER: See forum |
2.84% |
01% |
02% |
None/does not apply |
How large of a DEPOSIT do you usually take, for new framing orders? Sep 2011 and Aug 2008 (139 participants, 160 participants)
| 9/2011 | 8/2008 | |
| 0% | 0% | None/Not a Framer/Does Not Apply |
| 12.23% | 8% | 00% No deposit due in advance |
| 1.44% | 1% | ~25% (1/4) |
| 1.44% | 3% | ~33% (1/3) |
| 68.35% | 70% | ~50% (1/2) |
| 0.72% | 0% | ~66% (2/3) |
| 0.72% | 0% | ~75% (3/4) |
| 15.11% | 14% | 100% Full payment due in advance |
| n/a | 4% | Variable |
8th ANNUAL TECHNOLOGY POLL- NOVEMBER 2010 149 participants
Combined with current results, at the top of this survey
HOW BIG IS YOUR FRAME SHOP? - DECEMBER 2009
Conducted December 2004, and December 2009
SIZE/SF OF YOUR RETAIL SPACE, INCLUDING WORK AREA?
| 12/2009 | 12/2004 | Shop Size |
| 01% | 02% | Does not apply/None |
| 09% | 05% | Less than 600sf |
| 11% | 12% | 601-900sf |
| 16% | 18% | 901-1200sf |
| 15% | 14% | 1201-1500sf |
| 15% | 17% | 1501-2000sf |
| 10% | 10% | 2001-3000sf |
| 09% | 07% | 3001-4000sf |
| 02% | 04% | 4001-5000sf |
| 03% | 02% | 5001-6000sf |
| 01% | 02% | 6001-7000sf |
| 02% | 02% | 7001-10000sf |
| 01% | 01% | 10001-20000sf |
| 00% | 01% | 20001-30000sf |
| 00% | 01% | 30001-40000sf |
7th ANNUAL TECHNOLOGY POLL- NOVEMBER 2009 141 participants
Combined with results at the top of this survey
Which industry event(s) do you hope to attend in 2010? - October 2009 (209 participants)
50% WCAF - Las Vegas, NV Jan 25-27
32% PPFA chapter regional show or meeting
23% Small regional/vendor show/open house (LJ, DM, TC, etc)
22% NONE
20% PMA 2010 (PPFA) - Anaheim, CA Feb 21-23
17% Decor Expo Atlanta - Sep TBD
02% SMAC - Paris, France Jan 17-19
02% Spring Fair - Birmingham, UK Feb 7-11
02% Other A (please post w/explanation)
01% Quadrum SACA - Bologna, Italy Feb 10-21
HOW MUCH DO YOU CHARGE FOR YOUR 24X36 "POSTER SPECIAL"? - SEPT 2009 (121 participants)
(w/metal or wood, reg glass, dm/backing, fitting, hanger. price before upgrades)
52% of shops surveyed offer some sort of "poster special"
11% $45.00-$54.99
11% $55.00-$64.99
27% $65.00-$74.99
17% $75.00-$84.99
10% $85.00-$94.99
11% $95.00-$104.99
03% $105.00-$114.99
05% $115.00-$124.99
02% $125.00-$134.99
03% $135.00-$149.99
Average from survey is approximately $80.47
DO YOU COOPERATE WITH LOCAL COMPETITORS? - August 2009 (159 participants)
89% YES
09% NO
02% DOES NOT APPLY
What is your avg retail sale for custom framing? - July 2009 (125 participants)

View Poll Results: What is your retail avg for custom frames sold? (12 mos) (125 participants)
01% None / Does Not Apply / Not a Framer
02% Don't Know / Don't have a POS
01% Less than $50 avg per frame
03% $50-$74
02% $75-$99
12% $100-$124
16% $125-$149
12% $150-$174
19% $175-$199
05% $200-$224
06% $225-$249
10% $250-$274
05% $275-$299
06% greater than $300 avg per frame
What percentage of your past 12mo glazing sales have had UV reduction glazing? - June 2009 223 participants

How many hours per week are you working in (or for) your shop? - May 2009 150 participants
The average grumbler works about 48 hours per week, per the results of this survey.

What is your shop's primary method to join wood frames? - April 2009 223 participants
78% Vnailer
07% Nails
07% Thumbnails
04% Pre-JOINED by vendor
02% GLUE ONLY (controversial, see thread)
01% OTHER
01% Biscuits
01% Splines
00% Wedges
Does your shop offer fabric mats/liners? - March 2009 109 participants
75% YES
25% NO
Open Discussion "What is the most unique or fun thing you have framed?" - February, 2009
Results: http://www.thegrumble.com/showthread.php?t=37336
How were your 2008 vs 2007 Gross Sales? - January, 2009 109 participants

ANNUAL TECHNOLOGY SURVEY - NOVEMBER 2008 197 participants
Combined with other years. See most current poll (above)
How often do you update your shop's
window displays? OCT 2008 (76
participants)
42% Monthly
22% Quarterly
12% NONE/Does Not Apply/I dont have windows
11% Weekly
05% Every 6 months or so
04% Yearly
04% OTHER
00% Never, since initial opening
Which BACKING PAPER do you generally use? Sep 2008 (see Sept 2011 comparison)
How much of a deposit do you generally ask for, when new customers order framing? August 2008 (160 participants)
Please see September 2011 for comparative results from both years
Customer Satisfaction Policy
Survey - JULY 2008 (89 participants)
Survey Time Stats: Average Completion Time: 1min 5sec (Min: 0min
11sec, Max: 5min 23sec)
Is your customer satisfaction policy displayed in writing?
Examples: signage, printed on paperwork, website, etc
71% NO
29% YES
If customer does not care for their mat or moulding selection during
the first month:
28% They pay for materials only, at discounted price
27% They pay nothing (work done at shop expense)
21% They pay for materials only, at regular price
15% They pay full price for re-do (materials and labor)
10% OTHER - explained in forum
00% They pay for labor only
How long do you warrantee your work for free repair?
Examples: failed hinge, particles inside pkg, moulding issues, etc
01% Less than 1 month
04% 1 - 6 months
04% 6 - 12 months
11% 1 - 2 years
02% 2 - 3 years
00% 3 - 4 years
04% 4 - 5 years
08% 5 - 10 years
02% 10 - 15 years
02% 15 - 20 years
60% 20+ years
Have you recently updated your new
personal GRUMBLE PROFILE? June 2008 (87 participants)
45% YES
46% NO - But I plan to do so shortly
09% NO - I'm not interested
At what age do you expect to retire?
MAY 2008 (157
participants)
01% None/Does Not Apply
02% At age 18-54
06% At age 55-59
05% At age 60-61
10% At age 62-64
16% At age 65-70
15% At age 71-75
04% After age 76
41% Never
How is your business set up as an
entity/how does it file? APRIL 2008
(161
participants)
38% Sole Proprietor/Personal Responsibility
(1040 C)
29% S-Corp/INC
25% LLC/Limited Liability Company or LLC Partnership
05% C-Corp/INC (1120)
02% Traditional Partnership (1065)
01% OTHER (please explain in post)
01% NONE/DOES NOT APPLY/DONT KNOW
00% Trust (1041)
00% Non-Profit Organization
Which MAT VENDORS do you carry in
your shop? MARCH 2008
(137
participants)
96% Bainbridge
93% Crescent
63% Artique (LJ)
24% Frank's Fabrics
11% Raphael's
09% Peterboro
09% Rising
07% Falcon East
06% Framing Fabrics
02% Specialty
<1% Crossroads, Marino, Superior, AMCI, Other
Overall market share by mat vendor (137 participants)
30% Bainbridge
29% Crescent
19% Artique (LJ)
07% Frank's Fabrics
03% Raphael's
03% Peterboro
03% Rising
02% Falcon East
02% Framing Fabrics
01% Specialty
<1% Crossroads, Marino, Superior, AMCI, Other
Fabric Company Results: (65 participants)
51% Frank's Fabrics
23% Raphael's
14% Falcon East
12% Framing Fabrics
What was your shop's 2007 Gross
Income? FEB 2008 (105
participants)
11% Under 50k for the year
18% 50k - 99k
20% 100k-149k
14% 150k-199k
06% 200k-249k
06% 250k-299k
06% 300k-349k
01% 350k-399k
01% 400k-449k
03% 450k-499k
08% 500k-749k
03% 750k-999k
01% 1mil-1.24mil
01% 1.25mil-1.49mil
03% Greater than 1.5 million
How many different moulding vendors
does your shop offer? January 2008 (141 participants)
Average: ~7.5 vendors
01% NONE / Does Not Apply
01% 1
06% 2
11% 3
07% 4
13% 5
12% 6
06% 7
09% 8
04% 9
07% 10
05% 11
04% 12
02% 13
02% 14
01% 15
01% 16
01% 17
01% 18
06% 19 or more moulding vendors/companies are carried
UNCLAIMED ORDERS SURVEY & DISCUSSION
12/2007 (89 participants)
Survey Time Stats: Average Completion Time: 0min 35sec (Min:
0min 10sec, Max: 3min 31sec)
What is the longest a single order has been held, without being picked
up?
09% 1 - 5 months
12% 6 - 12 months
11% 2 years
17% 3 years
10% 4 years
07% 5 years
18% 6 - 10 years
09% 11 - 15 years
02% 16 - 20 years
04% 21+ years
For the order mentioned above, what deposit was taken?
42% NONE / Does Not Apply
07% ~25% deposit
02% ~33% deposit
36% ~50% deposit
13% 100% deposit
ANNUAL TECHNOLOGY SURVEY - NOVEMBER 2007 158 participants
Combined with other years. See most current poll (above)
DOES YOUR SHOP OFFER BOTTOM WEIGHTING?
(98 participants)
Average Completion
Time: 0min 22sec (Min: 0min 3sec, Max: 3min 52sec)
00% Does not apply to my business type
40% Yes - Almost always
42% Yes - Rarely - only when visually needed
11% Yes - Only if customer asks
07% No - Almost never
WHAT PERCENTAGE RANGE REPRESENTS
A TYPICAL MONTH FOR THE FOLLOWING TYPES OF FRAMING?- SEPT 2007
(64 participants)
Average Completion Time: 1min 39sec (Min: 0min 37sec, Max:
8min 13sec), Average Time before Quit: 0min 58sec
In this section, We are comparing BY NUMBER OF PIECES/JOBS taken in:
1. BY #: HIGH END (Finished corner, etc)
0% None - 9 14.06%
1%-10% - 27 42.19% ***
11%-20% - 9 14.06%
21%-30% - 6 9.38%
31%-40% - 3 4.69%
41%-50% - 2 3.12%
51%-60% - 1 1.56%
61%-70% - 2 3.12%
71%-80% - 3 4.69%
81%-90% - 2 3.12%
91%-100% - 0 0.00%
2. BY #: Bread and butter/middle of the road
0% None - 0 0.00%
1%-10% - 1 1.56%
11%-20% - 4 6.25%
21%-30% - 2 3.12%
31%-40% - 4 6.25%
41%-50% - 5 7.81%
51%-60% - 13 20.31%
61%-70% - 14 21.88% ***
71%-80% - 12 18.75%
81%-90% - 5 7.81%
91%-100% - 4 6.25%
3. BY #: LOW END/LOWEST COST (under $1.50 cost, etc)
0% None - 7 10.94%
1%-10% - 23 35.94% ***
11%-20% - 20 31.25%
21%-30% - 6 9.38%
31%-40% - 4 6.25%
41%-50% - 2 3.12%
51%-60% - 1 1.56%
61%-70% - 1 1.56%
71%-80% - 0 0.00%
81%-90% - 0 0.00%
91%-100% - 0 0.00%
In this section, We are comparing BY DOLLAR VALUE taken in:
4. BY $: HIGH END (Finished corner, etc)
0% None - 10 15.62%
1%-10% - 17 26.56% **
11%-20% - 10 15.62%
21%-30% - 8 12.50%
31%-40% - 4 6.25%
41%-50% - 1 1.56%
51%-60% - 5 7.81%
61%-70% - 2 3.12%
71%-80% - 3 4.69%
81%-90% - 3 4.69%
91%-100% - 1 1.56%
5. BY $: Bread and butter/middle of the road
0% None - 0 0.00%
1%-10% - 4 6.25%
11%-20% - 6 9.38%
21%-30% - 2 3.12%
31%-40% - 3 4.69%
41%-50% - 5 7.81%
51%-60% - 13 20.31%
61%-70% - 8 12.50% ***
71%-80% - 13 20.31%
81%-90% - 5 7.81%
91%-100% - 5 7.81%
6. BY $: LOW END/LOWEST COST (under $1.50 cost, etc)
0% None - 7 10.94%
1%-10% - 28 43.75% ***
11%-20% - 17 26.56%
21%-30% - 6 9.38%
31%-40% - 2 3.12%
41%-50% - 2 3.12%
51%-60% - 1 1.56%
61%-70% - 0 0.00%
71%-80% - 0 0.00%
81%-90% - 1 1.56%
91%-100% - 0 0.00%
HOW OFTEN DOES YOUR SHOP SEND POSTAL MAIL TO ITS CLIENTS 8/2007 (79 participants)
03% Does Not Apply/Not a shop
25% None/NO mailings were done in the past 12 months
44% 1-3 mailings in the past 12 months
18% 4-6 mailings in the past 12 months
04% 7-9 mailings in the past 12 months
03% 10-12 mailings in the past 12 months
03% Greater than 12 mailings in the past 12 months
Loss Prevention and Fraud Survey- July 2007 (82 participants)
74% Orders never picked up/not paid
51% Uncollected Checks (NSF, etc)
45% E-mail scam attempt
43% Advertising scam attempt (phone directory, website, etc)
37% Shoplifting
32% Phone scam attempt via relay operator
26% Abuse of company dumpster/trash container
26% Flood or plumbing damage
24% Vandalism outside shop
22% Employee theft: Time/Scheduling
21% Employee theft: Cash
21% Employee theft: Frames
20% Break-in/theft after hours
18% Cust damaging art & not paying for it
17% Employee theft: Giving away Mdse or under charging
17% Employee theft: Materials
15% Credit card defalcation (charge backs)
13% Credit card fraud in store
11% Corporate account bankruptcy/write off
10% Counterfeit currency/bills
09% Worker's comp or sick time abuse
07% Sexual harassment issue/complaint
07% Employee theft: Art
07% Employee theft: Gift items
07% Identity theft: Personal
06% Supplier/Vendor fraud
06% Vandalism inside shop
05% Consigner/artist fraud
05% Counterfeit checks
05% NONE OF THE ABOVE/DOES NOT APPLY
04% Credit card fraud by phone
04% Employee theft: Customer database/mailing list
02% Counterfeit traveller's checks
02% Internet or wireless break-in/data loss
02% Stolen keys
02% Employee theft: Theft of or lost deposit
02% Employee theft: Other (please see forum post)
02% Legal defense/complaint (Slip & fall, liability, etc)
02% OSHA compliance issue/complaint
01% ADA compliance issue/complaint
01% Employee theft: Client credit card numbers
01% Employee theft: Abuse of company vehicle or fuel account
01% Credit card fraud online
01% Counterfeit bank or money orders
01% Identify theft: Corporate
01% Fire/Arson causing downtime
00% Counterfeit purchase order
00% Armed robbery
00% Bomb threat causing downtime
What FRAMING RELATED extras/special items do you offer? June 2007 (116 participants)
07% Art rental or leasing
69% Art or print ordering service
10% Art/frame appraisals or consulting
61% Bevel accents
41% Canvas transfers
21% Compo corners
97% Fillets
72% Frames/Liners: fabric wrapped
31% Frames: custom finished/milled
48% Frames: finished/closed corner style
16% Frames: leather wrapped
66% Frames: oval or special shape
11% Gilding service
12% Glass etching service
34% Mail order or shipping service
71% Mats: fabric wrapped
52% Mats: French lines or panels
56% Mats: painted bevels
90% Mats: v-grooves
91% Museum type glass option
91% Name plates (outsourced or in-house)
55% On-site art hanging/installation
55% On-site home/office consulting
27% Printing to paper or canvas
66% Optional one day rush service
34% Oversize beyond 48x96
36% Plaque-it type mounting service
89% Preservation/Archival hinging
41% Readymade mats
59% Readymade frames
16% Restoration of paper, paint, or frames (conservator grade)
43% Restoration of paper, paint, or frames (very minor)
53% Restoration via digital reproduction (digital custom, etc)
12% Custom CMC/CAD mat design
07% OTHER Special Service/Treatment (please see forum)
00% None/None apply to my situation/Not a Framer
Do you ask clients to SIGN at the design counter?- May 2007 122 participants
66% Yes - for credit card transactions, per bank requirement
28% Yes - Upon approval of design / limit of liability disclaimer / condition
report
20% NO/None Apply or Not a Framer
11% Yes - For Corporate jobs, PO, and clients with terms
07% Yes - When order is completed/at time of pickup
03% OTHER/NOT IN CHOICES ABOVE (see messages)
02% Yes - For NON-framing/gift item sales
Bring Items to Auto Survey- April 2007 172 participants
Do you or your staff offer to bring completed orders to
the customers vehicle?
97% Yes, when possible/properly staffed
02% No, this is not a service we provide
01% None/Does Not Apply/Not A Framer
Poly Moulding Survey- March 2007 119 participants
Of those surveyed, 77% DO NOT currently offer Poly Mouldings.
Their reasons:
49% Quality concerns
22% Framer/Employee resistance
16% Availability/no established source
13% Do not know how to cut/join it
12% OTHER (see forum for explanation and discussion)
11% Customer resistance
05% Do not know how to sell it
03% Variety of profiles & finishes
02% Do not know how to earm more profit with it
Of those surveyed, 21% DO offer Poly Mouldings.
How long have you offered poly mouldings?
20% Less than 1 year
04% 1-2 years
28% 2-5 years
48% 5+ years
How do you display your poly samples?
61% We display them mixed with wood samples
30% We display them in a special section
09% We keep them out of customer view until needed
Who do you sell poly mouldings to?
48% We offer them to Retail Sales
29% We offer them to Commercial and Resale clients
23% Only when price is an issue, as a sale saver
How do you price/mark up poly mouldings?
62% Higher markup than that of wood offerings?
38% Similar markup to that of wood offerings
00% Lower markup than that of wood offerings?
Feb 2007: Which kind of frame shop are you at? (174 participants)
66% Independent w/single location
12% Home Based (Garage, Basement, Barn, Van, etc)
08% Independent w/multi locations
07% Franchise (DTW, TGFU, FF, Big Picture, etc)
03% Big Box/National Chain (M's, ABros, JA's, HL, Corners, etc)
02% NONE / DOES NOT APPLY
01% Corporate/Wholesale/Commercial Framer
01% OTHER (Please explain in a post)
00% E-Commerce/Mail Order Only
How does your shop wrap completed orders? - January 2007 177 participants
58% Clear plastic bags
42% Kraft or other paper
23% We use corners IN ADDITION to the above
12% Bubble Wrap
10% Corrugated Cardboard
10% Stretch wrap
09% Unwrapped w/corners
08% Unwrapped
05% Retail shopping bag
04% Thermal shrink wrapped
01% OTHER/Not Listed
Which Trade Show(s) Do You Plan To Attend in 2007? - December 2006 94 participants
50% WCAF/PFM - Las Vegas, NV. Jan 28-30
31% Decor Expo - Atlanta, GA. Sep 7-9
19% Decor Expo - Baltimore, MD. Apr 27-29
19% PMA/PPFA - Las Vegas, NV. Mar 7-11
18% None - Not planning to attend any shows
13% Other, vendor, or small regional show(s)
03% Quadrum SACA - Bologna, Italy. Feb 15-18
03% Spring Fair - Birmingham, UK. Feb 4-8
02% SMAC - Paris, France. Mar 18-20
01% AFEX - Niagara, NY. TBA
ANNUAL TECHNOLOGY SURVEY - NOVEMBER 2006 283 participants
Combined with other years. See most current poll (above)
MOULDING VENDOR POPULARITY SURVEY- OCTOBER 2006 172 participants
WHICH MOULDING VENDORS DO YOU CARRY?
79.07% Larson Juhl
63.95% Nielsen Moulding
47.09% Roma Moulding
41.28% Nurre Caxton
36.63% Decor Moulding
35.47% Inline Ovals
33.14% AMPF Moulding, Studio Moulding
31.98% Omega Moulding
26.16% Designer Moulding
26.16% Framerica
19.19% Max Moulding
17.44% Arquati Moulding
16.86% Presto Frame & Moulding
16.28% AMCI Moulding
15.12% Bella Moulding
14.53% Franks Fabrics (Liners), Williamson Moulding
13.95% Gryphon Moulding
13.39% Fotiou Frames
12.79% CMI Mouldings, Picture Woods
11.63% DonMar Creations, Raphael's Master Source Liners
11.05% J. Orr Moulding & Chop Service, United Picture Framing Supplies
10.47% Vermont Hardwoods, OTHER - National company
9.88% Abe Munn, Gemini Moulding, Nelsons Moulding & Frames
9.30% Design Guild Moulding, Engelsen Frame & Moulding Co, Turner Assoc
8.14% Garrett Moulding, OTHER - Local or regional company, Southern Moulding,
Tracy Chop Service
7.56% Bravura Moulding, Wall Moulding Assoc
6.98% PB&H Moulding
6.40% Vicki Schober
5.81% Burnich Moulding, Framers Inventory, LaVille Frames, Presto Readymades
5.23% Art-O-Rama, DJ Wholesale, G&G Moulding Co, Regence Picture Frames,
TC Moulding, Universal Framing Supplies
4.65% Chop Right, Framing Fabrics, Monarch Moulding, Our own brand / manufactured
in-house
4.07% APF, Bay, Bendix, CDNV Wood Carving, Framers Market - CT, Framing Suppliers
Birmingham, Furst Bros, Pacific Framing Supply OR
3.49% ABC, Americas Choice, Artisan Moulding, Blue Ridge, CJ, Evald, OTHER -
Imported directly from manufacturer, Proframe, Roanoke Moulding
2.91% A Street, Bob Victor's, Cash, Crossroads, Jayness, LaMarche, Putnam, Rhonda
Feinman, Singleton, Valley Moulding
2.33% Aetna Moulding, Alumaframe, Armel, Art Express, Cabhail, Colonial, Delta,
European Art, Frame Guild, LeWinter, NJ, Picture & Frame Ind, Shenandoah,
Southwinds
NOTE: This summary only includes the top 98%. For the rest, please see the full results in the original poll.
MONTHLY SURVEY- SEPTEMBER 2006 This month was skipped due to grumble upgrade.
WHAT'S ON *YOUR* COUNTERTOP?- AUGUST 2006 91 participants
DESIGN & SALES COUNTER: What surface material do you
use for the countertop?
42% Formica
15% Carpet
15% Wood
09% Tempered glass
05% Fabric
03% Other(please post on forum)
02% Stone
02% Coroplast
01% Linoleum
01% Naughahide
01% Paper or kraft
01% Teflon or other plastic
01% NONE/Does Not Apply
00% Ceramic tile, Plexi, Faux stone, Brick, Leather, Cardboard, Foamcore, Stainless
or metal
DESIGN & SALES COUNTER: WIDTH of this counter? (left to
right. combined, if multiple)
01% None/Does Not Apply
05% Less than 3 feet wide
22% 3-3.99 feet wide
09% 4-4.99 feet wide
11% 5-5.99 feet wide
08% 6-6.99 feet wide
04% 7-7.99 feet wide
14% 8-8.99 feet wide
03% 9-9.99 feet wide
09% 10-10.99 feet wide
00% 11-11.99 feet wide
04% 12-12.99 feet wide
09% 13 feet or wider
DESIGN & SALES COUNTER: HEIGHT of this counter? (from
floor to top surface)
01% None/Does Not Apply
04% Less than 30" high
07% 30-30.99" high
02% 31-31.99" high
14% 32-32.99" high
03% 33-33.99" high
08% 34-34.99" high
09% 35-35.99" high
21% 36-36.99" high
05% 37-37.99" high
05% 38-38.99" high
02% 39-39.99" high
10% 40-40.99" high
02% 41-41.99" high
02% 42.42.99" high
03% 43" or higher
FITTING TABLE: What surface material do you use for the countertop?
29% Carpet
24% Paper or kraft
10% Cardboard
09% Coroplast
05% Other(please post on forum)
04% Linoleum
04% Foamcore
03% Wood
03% Formica
03% Fabric
01% Tempered glass
01% Plexi
01% Teflon or other plastic
01% None/Does Not Apply
00% Ceramic tile, Stone, Faux Stone, Brick, Leather, Naughahide, Stainless or
other metal
FITTING TABLE: Width of this counter? (left to right. combined,
if multiple)
01% None/Does Not Apply
00% Less than 3 feet wide
10% 3-3.99 feet wide
24% 4-4.99 feet wide
07% 5-5.99 feet wide
13% 6-6.99 feet wide
02% 7-7.99 feet wide
23% 8-8.99 feet wide
02% 9-9.99 feet wide
04% 10-10.99 feet wide
01% 11-11.99 feet wide
02% 12-12.99 feet wide
10% 13 feet or wider
FITTING TABLE: HEIGHT of this counter? (from floor to top
surface)
01% None/Does Not Apply
00% Less than 30" high
02% 30-30.99" high
00% 31-31.99" high
04% 32-32.99" high
01% 33-33.99" high
10% 34-34.99" high
10% 35-35.99" high
29% 36-36.99" high
11% 37-37.99" high
11% 38-38.99" high
03% 39-39.99" high
09% 40-40.99" high
03% 41-41.99" high
03% 42.42.99" high
02% 43" or higher
WHAT KIND OF COMMUNITY IS YOUR SHOP IN?- JULY 2006 106 participants
TYPE of community you are located in
50% City
32% Town
08% Village
06% Rural
04% OTHER (see thread)
POPULATION of your community
02% 1-1,999
13% 2,000-9,999
30% 10,000-34,999
29% 35,000-99,999
13% 100,000-499,999
06% 500,000-999,999
01% 1,000,000-1,999,999
03% 2,000,000-4,999,999
02% 5,000,000 or higher
01% OTHER (please explain)
HOW FAR is the nearest large City of 500,000 or more?
01% NONE/Does Not Apply
19% 0-5 miles (or you are IN it)
07% 6-10 miles
08% 11-20 miles
13% 21-50 miles
22% 51-100 miles
31% 100 miles or more
WHAT KIND OF SHOP SPACE DO YOU HAVE?- JUNE 2006 168 participants
WHAT TYPE OF SPACE DO YOU HAVE?
39% Free-Standing building
36% Strip Mall
11% Other (see forum)
08% Home
03% Shed/Garage/Barn next to home
02% Mall Store
01% Vehicle (on-site service only)
01% None/Does Not Apply
00% Mall Kiosk
HOW MANY PUBLIC/RETAIL ENTRANCES DOES YOUR SPACE HAVE?
73% One entrance
21% Two entrances
01% Three or more entrances
05% None/Does Not Apply
WHAT TYPE OF TERMS DO YOU HAVE FOR YOUR SPACE?
45% Rent/Lease - 2-5 year lease
13% Rent/Lease - month to month lease
10% Commercial - owned with mortgage
10% Residential Property (any)
07% Rent/Lease - 6-10 year lease
06% Rent/Lease - 1 year lease
06% Commercial - owned without mortgage
02% Rent/Lease - 11+ year lease
02% None/Does Not Apply
01% Other (see forum)
WHAT TYPE OF CUSTOMER PARKING SITUATION DO YOU HAVE? (68% have a private
lot)
52% Private Lot - free, ample space
27% Street - free parking
14% Private Lot - free, never enough
08% Street - metered parking
07% Driveway
03% We design on-site and deliver
02% Parking Garage - paid by client
02% Other (see forum)
02% None/Does Not Apply
01% Pay Lot - paid by client
01% Parking Garage - free
01% City Area - walk-ins only
00% Pay Lot - free w/validation
00% Parking Garage - free w/validation
'HOW DO YOU BUY GLAZING?' SURVEY- May 2006
From the results, we see that more than half use CC/UV as a default, and about one third still use non protective glass.
It also shows that about:
- 93% stock CC/UV CLEAR/CONSERVATION
- 87% stock PC/CLEAR/NON PROTECTIVE
- 74% stock MUSEUM
- 73% stock RC/NONGLARE
- 68% stock CRC/NONGLARE
- 68% stock PCA/ACRYLIC CLEAR
- 61% stock CCA/ACRYLIC UV CLR
WHICH GLAZING TYPE IS YOUR "DEFAULT"?
54% CC/UV CLEAR/CONSERVATION *
34% PC/CLEAR/NON PROTECTIVE
06% None/Does Not Apply
03% CRC/NONGLARE UV
01% RC/NONGLARE CLEAR
01% PCA/ACRYLIC CLEAR
01% CCA/ACRYLIC UV CLEAR
00% MUSEUM
Which lite sizes do you buy/stock for PC/CLEAR/NON PROTECTIVE?
70% 32x40
42% 16x20
39% 24x36
36% 36x48
26% 22x28
24% 20x24
24% 40x60
20% 11x14
20% 24x30
16% 18x24
15% 26x32
13% NONE/Does Not Apply
10% 30x36
07% 12x16
07% 14x18
07% 30x40
05% 8x10
05% Float
03% 26x36
02% 28x36
02% OTHER
Which lite sizes do you buy/stock for CC/UV CLEAR/CONSERVATION?
86% 32x40 *
47% 36x48
44% 24x36
36% 16x20
36% 22x28
30% 20x24
30% 40x60
24% 26x32
23% 24x30
20% 18x24
07% 40x50
07% NONE/DOES NOT APPLY
05% 11x14
05% 12x16
05% 14x18
05% 30x40
01% 8x10
01% OTHER
Which lite sizes do you buy/stock for RC/NONGLARE CLEAR?
60% 32x40 *
26% NONE/DOES NOT APPLY
20% 16x20
18% 24x36
17% 36x48
16% 22x28
11% 24x30
10% 20x24
08% 16x32
08% 11x14
07% 40x50
05% 18x24
04% 40x60
03% 14x18
03% OTHER
02% 12x16
01% 30x40
01% 8x10
Which lite sizes do you buy/stock for CRC/NONGLARE U/V CLEAR?
54% 32x40 *
32% NONE/DOES NOT APPLY
19% 36x48
16% 22x28
16% 24x36
09% 16x20
06% 40x50
05% 18x24
05% 20x24
05% 24x30
05% 26x32
05% 40x60
02% OTHER
01% 8x10
01% 11x14
01% 12x16
Which lite sizes do you buy/stock for PCA/ACRYLIC CLEAR?
51% OTHER SIZE *
32% NONE/DOES NOT APPLY
11% 32x40
08% 40x60
03% 36x48
01% 18x24
01% 24x36
01% 30x40
Which lite sizes do you buy/stock for CCA/ACRYLIC UV CLEAR?
47% OTHER SIZE *
39% NONE/DOES NOT APPLY
12% 32x40
08% 40x60
03% 36x48
Which lite sizes do you buy/stock for MUSEUM?
58% 32x40
26% NONE/DOES NOT APPLY
17% 24x36
15% 36x48
13% 40x60
10% 16x20
06% 24x30
05% OTHER
04% 22x2
03% 30x40
02% 20x24
01% 26x32
NEEDLEWORK SURVEY- April 2006
Is this type of framing up or down? (declining)
46% About the same
37% DOWN
13% UP
02% We don't frame needle art
02% NONE/Does Not Apply
What percentage of total framing is represented by needle art?
(~79% of us said less than 10%)
53% 0-5%
26% 6-10%
04% 11-15%
05% 16-20%
02% 21-25%
03% 26-30%
02% 36-40%
01% 71-75%
04% NONE/Does Not Apply
Do you offer a service to clean needle art, prior to framing?
84% NO
09% YES
06% NONE/Does Not Apply
01% Other (see forum)
How do you price needle art?
65% United Inches
13% Flat/Fixed extra Fee
09% Square Inches
08% Other (see forum)
04% NONE/Does Not Apply
Do you market this specialty? How? (check any that apply)
39% We do NOT market this specialty service
32% Phone Book(s)
23% Web Site
19% Newspaper
19% Signage - in business
15% Newsletter
14% Direct Mail
14% Club/Organization
10% Signage - exterior of business
10% Flyers
10% Business Cards
09% Guest speaking engagements
04% Trade Show
04% NONE/Does Not Apply
03% Radio Ads
03% TV Ads
03% Other (see forum)
CREDIT CARDS & PAYMENT TYPES - March 2006
WHICH PAYMENT TYPES ARE ACCEPTED AT YOUR SHOP?
97% Cash
97% Business Check
95% Personal Check
94% Visa
94% Mastercard
69% ATM/Debit
68% American Express
61% Gift Certificate(paper)
58% Discover
13% Diner's Club
10% Barter Company
09% Gift Card(electronic)
07% PayPal
04% Wire Xfer
03% Carte Blanc
01% JCB
01% OTHER (see forum)
01% Does not apply/None
WHICH SINGLE PAYMENT IS USED THE MOST IN YOUR SHOP? (in $ volume)
52% Visa
17% Mastercard
17% Personal Check
05% ATM/Debit
03% Business Check
03% American Express
02% Cash
01% OTHER (see forum)
01% Does not apply (none)
HOW DO YOU PHYSICALLY PROCESS CARDS?
90% Standalone credit card terminal
06% Does not apply/None
02% Through our POS software
02% Knuckle Breaker
01% By telephone
MISC PAYMENT/PROCESSING QUESTIONS
69% We OWN our equipment
23% We RENT/LEASE our equipment
26% We have a merchant contract of 12 mos or more
27% We have a month to month merchant contract
26% Vendor provides paper/supplies free
69% Full card number does NOT print on customer copy
02% We don't ask for a signature for transactions below $50
20% We check ID's for new customers using a check
08% We check ID's for new customers using a card
38% We have a PIN PAD for customers using debit cards
61% We are happy with our current processing vendor
01% OTHER- A (please see forum)
05% None of the above apply to my business
AVERAGE TICKET SIZE SURVEY - Feb 2006
What is YOUR shop's average custom framing ticket size?
01% $74 or less (in US $)
04% $75-$99
11% $100-$124
16% $125-$149
20% $150-$174 *
14% $175-$199
05% $200-$224
06% $225-$249
06% $250-$274
03% $275-$299
08% $300 or more
03% NONE / Does Not Apply
01% I don't know/don't track such things
OTHER (please explain in a post) 0% (0)
Do you feel this has gone UP or DOWN in the past year?
50% UP (higher than
previous years)
32% SAME (about the same as previous years)
07% DOWN (lower than previous years)
02% I don't know/I don't track such things
09% NONE / Does Not Apply
HOW DO YOU BUY AND CUT MOULDING? HOLLOW OR FLAT GROUND? January 2006
How do you buy moulding? (multiple answers OK)
85% Length
64% Chopped
42% Box
33% Bundle
20% Closeout
18% Chopped & Joined
17% Straight Cut
04% None/Does Not Apply
02% Truckload (20+ boxes/custom discount)
01% Container/Direct from overseas
01% Other (please see thread)
Which of the following apply? (multiple answers OK)
65% We use a saw
61% We buy chops
59% We use a chopper
16% We buy frames pre-chopped & joined
04% None/Does Not Apply
Which is your PRIMARY method? (one answer)
43% We use a saw
32% We use a chopper
18% We buy chops
04% None/Does Not Apply
03% We buy frames pre-chopped & joined
If you have a chopper, how do you have the knives/blades sharpened?
39% Hollow Ground
30% Flat Ground
28% I dont know!
03% Other (please see thread)
HOW DO *YOU* PRONOUNCE "FILLET"?
- DECEMBER 2005
Is it FIL'-ET or is it FI-LAY' ?
80% FIL'-ET
19% FI-LAY'
01% Neither/I don't know/What is a fillet?
ANNUAL TECHNOLOGY SURVEY - NOVEMBER 2005
Combined with other years. See 11/2007 (above)
MONTHLY SURVEY SHOP ATTIRE- OCTOBER 2005
Does your shop have a (formal or verbal) dress code policy?
52% YES
44% NO
03% OTHER (please explain in post)
01% Does Not Apply/Not A Framer
Do you feel that employee appearance makes for a happier customer?
88% YES
07% NO
03% OTHER (please explain in post)
02% Does Not Apply/Not A Framer
How does your front counter staff generally dress? (Check any that
may apply)
TOP
62% Polo (37% plain, 25% shop branded)
46% Blouse
42% Dress Shirt (33% plain, 9% shop branded)
25% Tee-shirt (19% plain, 6% shop branded)
22% Apron (14% plain/vendor, 8% shop branded)
BOTTOM
55% Khaki style pants
52% Blue jeans
44% Slacks
37% Dress pants
30% Skirt
28% Other jeans
22% Dress
17% Shorts
FEET
63% Shoes
39% Sneakers
14% Open toe shoes
01% Stilettos
OTHER
21% We have visible tattoo restrictions
19% We have jewelry restrictions
04% Shop branded name tag on other shirt
02% Tie
02% Shop branded hat or cap
03% Does Not Apply
01% OTHER/NOT LISTED (please explain in a post)
CORNER SAMPLES ON LOAN SURVEY- SEPTEMBER 2005
Do you allow clients take corner samples from your shop?
81% YES
10% NO
08% OTHER (see thread for explanation)
01% Does not apply/None
Do you require a credit card or deposit when clients take samples?
70% NO
11% Does not apply/None
10% YES
09% OTHER (see thread for explanation)
COMPRESSED AIR SURVEY- AUGUST 2005
HOW OFTEN DO YOU BLEED/PURGE YOUR COMPRESSOR TANK?
09% Does not apply/None
02% More than once daily
21% Daily
05% Bi Weekly
15% Weekly
10% Every couple weeks
16% Monthly
08% Quarterly
05% Yearly
07% Never
02% OTHER (please explain)
DO YOU POWER YOUR COMPRESSOR OFF AT NIGHT?
69% YES
25% NO
05% Does not apply/None
WHERE DOES YOUR COMPRESSOR LIVE?
62% Back room
12% OTHER (please explain)
10% Basement
09% Sound proofed closet
05% Does not apply/None
02% Customer/retail area
WHAT TYPE OF COMPRESSOR DO YOU USE?
45% OTHER BELT/OIL/PANCAKE BASED (pricey, quiet, change oil every 500hrs) Bambi,
Silentair, etc
40% DIRECT DRIVE (economy, loud, ~500hr max life)
09% I DONT KNOW WHICH IT IS
05% Does not apply/none
WHAT DO YOU USE THE COMPRESSOR(S) FOR IN THE SHOP?
72% Joiner/Underpinner/Vnailer
65% Air nozzle or dust blower
57% Computerized Mat Cutter
45% Pneumatic staple gun
30% Point driver/fitting tool
13% Pneumatic saw
11% OTHER (please explain)
05% Does not apply/none
03% Pneumatic glue gun
01% Semi Manual Matcutter
01% Pneumatic canvas stretcher
DISCOUNTING SURVEY- JULY 2005
What types of discounts do you offer? (95% said
they do)
64% Volume
50% Designer/Decorator
44% Artist
39% "Percent off" promotions/coupons
37% Relatives
35% Corporate
30% "Dollars off" promotions/coupons
16% Police/Fire/City/Town
13% Student
13% Religious
12% Price matching local competitors for identical components
12% Club discount (AAA, Chamber, Lions Club, etc)
10% "Frequent Framer" program card
08% OTHER (please explain in a post)
05% Sr Citizens
05% I DO NOT OFFER DISCOUNTS
04% Accept local competitors printed coupons
03% (If order is) pre-paid
For those offering a "Dollars Off" discount, how much would
it be for a $140 sale?
07% $5 off
12% $10 off
19% $15 off
23% $20 off
33% $25 off
02% $30 off
02% $40 off
02% $50 off
For those offering a "Percentage Off" discount, how much
would it be for a $140 sale?
01% 5% off ($7)
38% 10% off ($14)
26% 15% off ($21)
26% 20% off ($28)
05% 25% off ($35)
01% 30% off ($42)
01% 40% off ($56)
PAYROLL SURVEY- JUNE 2005
HOW DO YOU PAY?
63% I pay hourly
24% I pay some of each
08% I don't have a payroll at this time
02% I pay salary
02% OTHER (see thread)
02% Does not apply/None
WHAT BENEFITS DO YOU OFFER?
08% I have no employees
07% I have no employees and receive coverage from my partner/spouse's employer
42% We offer HEALTH insurance
08% We offer DENTAL insurance
39% Coverage for owner(s)
24% Coverage for manager(s)
36% Coverage for full timer(s)
05% Coverage for part timer(s)
22% Coverage for employee's FAMILY
08% Coverage for employee's DOMESTIC PARTNER
10% Commission is paid for manager(s)
10% Commission is paid for entire sales staff
22% 1 week paid annual vacation
22% 2 weeks paid annual vacation
07% 3 weeks paid annual vacation
03% 4 weeks paid annual vacation
02% 5 or more weeks paid annual vacation
37% Paid sick days (within reason)
31% Paid annual vacation is on a graduated system that
increases with years of service.
24% Personal day(s)
12% Paid birthday
44% Personal framing at near cost
32% Personal framing at discount
07% Personal framing free
10% Life insurance
03% Profit sharing
10% 401k or equivalent
29% Bonus based on performance
34% Bonus for holiday
14% Tuition reimbursement: TRADE related education
02% Tuition reimbursement: GENERAL education
07% OTHER (see thread)
WHAT DO YOU LOOK FOR IN A POTENTIAL HIRE?
81% Personality
66% Basic math skills
53% Willingness to work weekends
44% Flexible hours/scheduling
42% I prefer prior framing experience
42% Sales background
41% Artistic background
37% References
27% I prefer a 'newbie' to the industry
22% High school diploma
08% CPF® or other trade designation
07% Does not apply/None
07% College degree (associates)
05% College degree (bach or higher)
05% OTHER (see thread)
What do you pay? NEW PART TIMER, NO TRADE EXPERIENCE:
04% Minimum wage
73% Less than $10/hr
18% $10.01-$12.00/hr
02% $12.01-$14.00/hr
02% $20.01-$22.00/hr
What do you pay? NEW FULL TIMER, NO TRADE EXPERIENCE:
05% Minimum wage
51% Less than $10/hr
35% $10.01-$12.00/hr
07% $12.01-$14.00/hr
02% Over $22.00/hr
What do you pay? SEASONED PART TIMER, 3+ YEARS EXPERIENCE:
22% Less than $10/hr
41% $10.01-$12.00/hr
15% $12.01-$14.00/hr
09% $14.01-$16.00/hr
09% $16.01-$18.00/hr
02% $18.01-$20.00/hr
02% $20.01-$22.00/hr
What do you pay? SEASONED FULL TIMER, 3+ YEARS EXPERIENCE:
04% Less than $10/hr
28% $10.01-$12.00/hr
33% $12.01-$14.00/hr
15% $14.01-$16.00/hr
09% $16.01-$18.00/hr
02% $18.01-$20.00/hr
02% $20.01-$22.00/hr
07% Over $22.00/hr
What do you pay? EXPERIENCED STORE MANAGER:
04% Less than $10/hr
07% $10.01-$12.00/hr
05% $12.01-$14.00/hr
30% $14.01-$16.00/hr
15% $16.01-$18.00/hr
15% $18.01-$20.00/hr
04% $20.01-$22.00/hr
07% $22.01-$24.00/hr
07% $24.01-$26.00/hr
07% Over $26.00/hr
AVERAGE AGE OF CLIENTS POLL- MAY 2005
How old would you say your average client is?
03% Does not apply
10% 31-35
17% 36-40
30% 41-45
28% 46-50
11% 51-55
01% 56-60
SPRING CLEANING POLL- APRIL 2005
How often do you change your window display(s)?
13% Does not apply
13% Weekly
45% Monthly
18% Quarterly
03% Every 6 months or so
01% Never since initial opening
07% OTHER: See Poll Discussion
How often do you re-arrange your gallery/showroom layout?
04% Does not apply
03% Weekly
24% Monthly
23% Quarterly
23% Every 6 months or so
06% Yearly
07% Every few years
06% Never since initial opening
06% OTHER: See Poll Discussion
How often do you re-arrange/sort your moulding samples?
01% Does not apply
04% Weekly
20% Monthly
17% Quarterly
32% Every 6 months or so
11% Yearly
06% Every few years
01% Never since initial opening
07% OTHER: See Poll Discussion
HOW OFTEN DO YOU EVALUATE AND ADJUST YOUR PRICING? - MARCH 2005
How often do you generally evaluate & adjust retail
prices? (labor, mld, etc)
26% Every month or so
22% Yearly
17% Every 6 months or so
10% Quarterly
10% I let the POS do it and never change markup multipliers or items indiv.
05% OTHER (please explain)
03% Every week or so
02% Every 5 years or more
02% I have never adjusted my prices
02% Does not apply/None
What factors are considered when you adjust your prices?
(check any that apply)
52% Increases in other operating expenses
43% Shop local competitors/local market to determine value
41% I rely on POS w/fixed multipliers and some manual adjusments
40% Custom feedback/resistance
40% Manual adjustment based on each item's earning capability/value
34% Evaluation through a COGS formula
28% Increase in rent
19% Just for giggles
07% I only adjust labor, glass, and special services.
07% Partner programs/discount programs
07% Box pricing discounts
05% Based on my rep's suggestions
05% CPF credentials and staff training
03% Rebate allowances
03% OTHER (please explain)
02% I rely on POS w/fixed markup multipliers only
02% Does not apply/None
02% 'free delivery' or hanging expenses
01% Vendor fuel surcharges
00% Free delivery allowances
00% Show discounts
HOW WAS BUSINESS IN 2003 COMPARED TO 2004? - FEBRUARY 2005
SUMMARY: 52% said sales are UP, 9% said ABOUT THE SAME, 22% said sales are DOWN, 15% question did not apply
08%
DOES NOT APPLY TO MY BUSINESS/ I DONT KNOW
07% I was not open both years
00% Sales were UP 200% or more
04% Sales were UP 100-199%
00% Sales were UP 75-99%
04% Sales were UP 50-74%
05% Sales were UP 40-49%
07% Sales were UP 30-39%
10% Sales were UP 20-29%
10% Sales were UP 10-19%
12% Sales were UP 1-9%
09% SALES WERE ABOUT THE SAME BOTH YEARS
07% Sales were DOWN 1-9%
10% Sales were DOWN 10-19%
02% Sales were DOWN 20-29%
02% Sales were DOWN 30-39%
00% Sales were DOWN 40-49%
01% Sales were DOWN 50-74%
WHAT IS YOUR HOURLY SHOP RATE? - JANUARY 2005
Rounded up to nearest $5
02% DOES NOT APPLY
04% $15
01% $20
01% $25
04% $30
05% $35
13% $40
12% $45
12% $50
07% $55
25% $60
07% $65
00% $70
05% $75
02% $80
00% $85
00% $90
01% $95
01% $100
00% Over $100/hr
HOW BIG IS YOUR FRAME SHOP? - DECEMBER 2004
See December 2009 (above) for comparison
SIZE/SF OF YOUR RETAIL SPACE, INCLUDING WORK AREA?
02% Does not apply/None
04% Home based
05% Less than 600sf
12% 601-900sf
18% 901-1200sf
14% 1201-1500sf
17% 1501-2000sf
10% 2001-3000sf
07% 3001-4000sf
04% 4001-5000sf
02% 5001-6000sf
02% 6001-7000sf
02% 7001-10000sf
01% 10001-20000sf
01% 20001-30000sf
01% 30001-40000sf
00% Over 40000sf
TOTAL EMPLOYEES AT YOUR SHOP, INCLUDING SELF AND PART TIMERS. (.5=pt,
1=ft)
07% Does not apply/None
05% .5 One part timer
21% 1 One FT or Two PT
17% 1.5 One FT & one PT or 3 PT, etc
17% 2
07% 2.5
03% 3
03% 3.5
04% 4
03% 4.5
03% 5
00% 5.5
01% 6
01% 6.5
01% 7
02% 7.5
00% 8
02% 8.5
00% 9
00% 9.5
00% 10
01% 10.5
03% 11 - 15
01% 15.5 - 20
HOW MANY YEARS HAS YOUR SHOP BEEN IN BUSINESS?
02% Does not apply/None
00% Still preparing to open
11% Less than 1 year
07% 1-2
05% 2-3
08% 3-4
03% 4-5
05% 5-6
03% 6-7
03% 7-8
02% 8-9
05% 9-10
13% 11-15
10% 16-20
08% 21-25
08% 26-30
05% 31-35
00% 36-50
02% 51-75
01% 76-100
00% Over 100 years
NOVEMBER 2004 TECHNOLOGY SURVEY:
Combined with other years. See 11/2006 above.
ARE YOU BRANDED? - OCTOBER 2004
HOW DOES MY SHOP APPLY BRANDING? (Check any that apply)
90% Business Cards
74% Company LOGO
70% Outdoor Signage
58% Company website
43% Newsletter & Mailings
37% Company SLOGAN
30% Branded Attire/Shirts/Aprons
30% Press Releases
21% Branded company vehicle
20% Public Speaking Engagements
08% Column in local paper
08% OTHER - Please explain
07% NONE - DOES NOT APPLY
04% Sponsor LL or sports team
02% Talk Shows
GLASS PRICING SURVEY - SEPTEMBER 2004
What is your price for 24x36 CLEAR/REGULAR? (labor & tax excluded)
(~97% carry)
03% DOES NOT APPLY / NOT OFFERED
02% 5.01-10.00
11% 10.01-15.00
23% 15.01-20.00
36% 20.01-25.00
11% 25.01-30.00
03% 30.01-35.00
05% 35.01-40.00
03% 40.01-45.00
02% 55.01-60.00
What is your price for 24x36 UV/CONSERVATION CLEAR? (~95% carry)
05% DOES NOT APPLY / NOT OFFERED
02% 15.01-20.00
03% 20.01-25.00
07% 25.01-30.00
15% 30.01-35.00
28% 35.01-40.00
18% 40.01-45.00
05% 50.01-55.00
08% 55.01-60.00
02% 60.01-65.00
03% 65.01-70.00
02% 75.01-80.00
02% 95.01-100.00
02% Over 100.00
What is your price for 24x36 REGULAR NON GLARE? (~92% carry)
08% DOES NOT APPLY / NOT OFFERED
02% 15.01-20.00
03% 20.01-25.00
08% 25.01-30.00
23% 30.01-35.00
21% 35.01-40.00
11% 40.01-45.00
08% 45.01-50.00
07% 50.01-55.00
02% 55.01-60.00
00% 60.01-65.00
03% 65.01-70.00
02% 90.01-95.00
02% Over 100.00
What is your price for 24x36 PLEXI CLEAR? (~85% carry)
15% DOES NOT APPLY / NOT OFFERED
07% 20.01-25.00
05% 25.01-30.00
08% 30.01-35.00
13% 35.01-40.00
13% 40.01-45.00
11% 45.01-50.00
08% 50.01-55.00
02% 55.01-60.00
03% 70.01-75.00
07% 75.01-80.00
05% 80.01-85.00
03% 85.01-90.00
What is your price for 24x36 A/R? (~51% carry)
49% DOES NOT APPLY / NOT OFFERED
08% 0.01-75.00
02% 75.01-100.00
02% 100.01-105.00
03% 105.01-110.00
10% 120.01-125.00
03% 125.01-130.00
07% 130.01-135.00
08% 135.01-140.00
02% 150.01-155.00
02% 155.01-160.00
02% 165.01-170.00
02% 190.01-195.00
02% Over 200.00
What is your price for 24x36 MUSEUM glass? (~77% carry)
23% DOES NOT APPLY / NOT OFFERED
02% 0.01-100.00
03% 100.01-125.00
05% 125.01-150.00
18% 150.01-175.00
10% 175.01-185.00
11% 185.01-195.00
05% 195.01-205.00
02% 205.01-210.00
02% 210.01-215.00
05% 215.01-220.00
02% 225.01-230.00
02% 235.01-240.00
02% 270.01-275.00
03% 285.01-290.00
02% 300.01-325.00
02% 325.01-350.00
03% Over 350.00
--------
F.A.C.T.S. SURVEY AUG/SEPT 2004
General Knowledge of FACTS. (Check all that apply)
75% I am aware of the FACTS document
69% I know what FACTS means
57% I have read the FACTS document
47% I understand the FACTS document
40% I am a financial supporter of FACTS
05% Until now I didn't know what FACTS stood for
I apply standards from the FACTS document to: (of the work done in
my business)
48% Most
32% Some
11% Does not apply
05% All
04% None
Pertaining to the FACTS website. (Check all that apply)
75% I have visited the FACTS website
35% I use the site to refer to the FACTS document
25% I find the site easy to navigate
18% I have never visited the site
14% I had difficulty navigating the site
Are you aware of and/or have you attended the classes on FACTS by Jim
Miller?
51% I am aware of the classes, but have not attended
34% I was unaware of the classes
15% Yes I have attended one of the classes
How valuable do you see FACTS is to the success of your business?
36% Somewhat valuable
33% Valuable
15% Greatly Valuable
10% Not valuable
07% Does not apply
Do you currently use FACTS as part of your marketing strategy?
65% No
21% Yes
14% Does not apply
In reading and understanding the document do you find it:
44% Somewhat difficult to read and understand
26% Easy to read and understand
09% Difficult to read and understand
20% Does not apply/unfamiliar
--------
TRADE SHOW POLL - AUGUST 2004
Which show(s) have you attended or plan to attend?
65% Sep - Decor Expo/ArtExpo Atlanta
34% Regional PPFA meetings/shows
33% Feb - Decor Expo/ArtExpo New York
29% Jan - West Coast Art & Frame Show Vegas
19% Feb - PMA/PPFA Show Orlando
19% May - East Coast Art & Frame Show - PA
14% Regional or distributor shows
10% Oct - PMA/PPFA Show Chicago
07% Oct - Art Framing Showcase NY
06% Jan - Decor Expo Florida
06% Oct - AFEX Art & Framing Expo Toronto, Canada
05% Apr - 3 Stars Over Texas Show TX
04% Apr - Northern Rockies Show - Montana
04% OTHER (feel free to comment)
02% Feb - Quadrum SACA Italy
02% NONE
01% Mar - SMAC Expo Paris France
01% Aug - Melbourne Australia show
01% Feb - Spring Fair UK
01% Sep - Photokina Cologne, Germany
Assuming most shows are 3 days, how many days do you usually hit the
show floor?
02% Does Not Apply
25% One Day
45% Two Days
28% Three Days
What do you hope to get out of the show(s)?
78% Education/Training/Classes
78% See the latest design trends
70% Meet fellow framers
69% Vendor "show specials" & sales
54% Find misc supply vendors
51% Find Moulding vendor
49% Free samples
46% Meet existing reps
29% Find Art suppliers
18% Find Merchandising vendor
14% Find CMC matcutter vendor
12% Find POS vendor
12% Find Glass vendor
12% Find Underpinner vendor
11% Find Saw/Chopper vendor
06% Find Matcutter vendor
06% OTHER (feel free to comment)
05% Join FramerSelect
02% Join PPFA
02% CPF Certification test
02% Does Not Apply
Would you attend a casual grumbler or hh social gathering?
90% Yes - I would be interested
07% No - I would not be interested
02% Does Not Apply
----------
"Think Like A Customer" Poll - JULY 2004
From a consumer's point of view, what do you think they consider MOST
important?
53% Price
38% Quality/Craftsmanship
33% Trust
31% Location/Parking/Hrs
19% Selection
09% Turnaround Time
06% OTHER (see comments)
02% Framer Credentials
From a consumer's point of view, what do you think they consider LEAST
important?
61% Framer Credentials
25% Turnaround Time
25% Location/Parking/Hrs
09% Selection
05% Quality/Craftsmanship
05% Price
04% Trust
04% OTHER (see comments)
Why do you suppose 85% of consumers DO NOT use the services of a custom
picture framer?
54% Price too high
43% Experience can be intimidating
28% OTHER (see comments)
08% Lack of Trust
04% Poor Location/Parking/Hrs
02% Poor Turnaround Time
01% Poor Quality/Craftsmanship
------------
BACKING PAPER SURVEY - JUNE 2004
See Sept 2008 for combined results from two periods
-----------
DEPOSITS AND TURNAROUND TIME POLL - MAY 2004
Average turnaround time summary:
7 days 21%
10 days 19%
14 days 34%
21 days 6%
Special note: Even though 34%/14 days is the winner, 48% complete the orders
in 10 days or less. Stats are so open to interpretation.
Deposits we generally ask for:
NO DEPOSIT: 24%
OTHER/MISC: 2%
25% (1/4): 3%
33% (1/3): 3%
50% (1/2): 63%
66% (2/3): 1%
75% (3/4): 0%
100%/Full: 3%
-----------
VIRUS, SPAM, SPYWARE, & ADWARE SURVEY - COMPUTER FORUM APRIL 2004
VIRUS:
79% have had a virus in the past
95% use a virus scanner
17% have an expired/non functional virus scanner
76% use Norton/Symantec / 14% use McAfee
ADWARE/SPYWARE/SCUMWARE:
81% have had an infection in the past
90% use a spyware scanner
55% use Ad-Aware / 26% use Spybot
SPAM:
Spam is a problem for more than 75% of us
POP UP BLOCKERS:
62% use a pop-up blocker program.
FIREWALL:
31% have NO firewall
33% have a router
19% use the firewall that comes with their operating system
17% use a third party (software based) firewall
-----------
CLOSED/FINISHED CORNER FRAMES SURVEY - APRIL 2004
Do YOU carry closed corner frames and what % of gross sales do they
represent?
04% DOES NOT APPLY
42% I DO NOT CARRY CLOSED CORNER FRAMES AT THIS TIME
34% 1%-5% (of gross sales)
09% 6%-10%
04% 11%-15%
02% 16%-20%
04% 26%-30%
02% 61% OR MORE
-----------
MARKETING/ADVERTISING POLL - MARCH 2004
WHAT FORMS OF ADVERTISEMENT HAVE YOU USED IN THE PAST 24 MONTHS?
72% Business cards handed out / networking
68% Yellow Page ads (phone company book)
64% TIED: Charity donations for ad, Newspaper (sm/community) ads, Referral from
previous customer
55% Window display
49% Outdoor signage update / drive by traffic
42% OTHER direct mail method
34% TIED: Newspaper press release (free), Thank you note to recent customers,
Web page, Yellow Page ads (alternate yellow page vendor)
28% Partnership w/complimentary local businesses (photographer, etc)
23% TIED: Radio advertising, Thank you note to recent customers w/coupon or
offer
21% TIED: Booth/table at event or trade show, Referral from organization (PPFA,
FS, FG, Chamber, BBB, etc), Team/School/Church sponsorship, Vehicle lettering/branding
19% TIED: FramerSelect(tm) card mailing, Frequent framer incentive program/discount
cards , Newspaper (large/major) ads
17% TIED: Cable TV advertising, Newsletter mailed to existing customers, Opening/Gallery
Invitation mailing, Public speaking at local events (chamber, xstitch group,
etc), Sales marketing calls/visits to local businesses, Web page with coupon
or promotional offer
15% TIED: Holiday thank you gifts (basket, gc, readymade, bottle, etc), OTHER
display ad method
13% TIED: Magazine ads (local level), Newsletter mailed to existing customers
w/coupon or promo, OTHER print marketing method, Val-Pak(tm) program mailing
11% TIED: Bainbridge(tm) card mailing, Mailing list purchased w/pre qualified
criteria, Newsletter sent by email or web
09% TIED: Decor Home Magazine(tm), Entertainment Book(tm) program coupon, Newspaper
(large/major) ads w/coupon or promotion, Television advertising
08% TIED: Flyers placed in public places or on cars, LJ(tm) card mailing, Nurre(tm)
card mailing, SuperCoups(tm) program mailing
06% TIED: Mailing list purchased w/new home owners only, Newspaper (large/major)
ads w/coupon or promotion, Placemat ads, RSVP(tm) program mailing
04% TIED: Magazine ads (national level), Money Mailer(tm) progam mailing, Newspaper
press release (paid ad), Other mass broadcast method, Telephone/Telemarketing
from existing customer base, Telephone/Telemarketing from existing customer
base, Web search engine paid placement/inclusion/paid clicks program
02% TIED: AAA/AARP/Club/association discount program, Billboard ads, Bus stop/shelter
ads, Newsletter sent by email or web w/coupon, Pocket Coupons(tm) program mailing,
Shopping cart ads, Welcome Wagon(tm) program mailing, Yellow Page or phone book
plastic COVER ADS
Note: The results show only what grumblers have tried, and may not be a true
representation of the whole industry. The results show what we tried, not what
was effective. For effectiveness discussion, please see the original discussion
thread.
---------
MOULDING, MAT & GLAZING SURVEY FEB 2004
WHICH TYPE OF GLAZING IS YOUR STANDARD/DEFAULT?
48% UV Clear
41% Clear Regular
3% Non Glare
3% UV Non Glare
2% Clear Acrylic
2% UV Acrylic
2% NONE OF THE ABOVE/DNA
WHAT KINDS OF GLAZING DO YOU CARRY/OFFER?
97% Clear Regular
95% UV Clear
91% Non Glare
78% UV Non Glare
78% Clear Acrylic
69% UV Acrylic
64% Mirror, Bev
62% Mirror, Std
56% Museum
48% Non Glare Acrylic
42% UV Non Glare Acrylic
36% TV A/R
17% Denglass
16% Image Perfect
5% OTHER, Not Specified
HOW MANY MAT SAMPLES DO YOU DISPLAY IN YOUR SHOP? (AVERAGE ~925)
<50 3%
50-99 3%
100-249 8%
250-499 22%
500-999 28%
1000-1499 20%
1500-1999 6%
2000-2499 6%
>2500 3%
MATBOARD VENDOR POPULARITY (carried) FOR GRUMBLERS SURVEYED:
92% Bainbridge
89% Crescent
62% Tru Vue
48% Artique (LJ)
16% Other/Not Listed
9% Raphael's
3% Bainbridge-Blick
2% Matboard Design Co.
HOW MANY MOULDING SAMPLES DO YOU DISPLAY IN YOUR SHOP? (AVERAGE: ~1900)
51-100 3%
101-250 6%
251-499 5%
500-999 16%
1000-1499 14%
1500-1999 11%
2000-2499 20%
2500-2999 3%
3000-3499 11%
3500-3999 3%
4000-4499 2%
4500-5000 2%
> 5001 3%
Other/DNA 2%
MOULDING VENDOR POPULARITY(carried) FOR GRUMBLERS SURVEYED:
80% Larson Juhl
70% Nielsen
42% LaMarche
39% Roma
38% Studio
33% Decor
31% Nurre Caxton
30% Designer
27% AMPF
27% OTHER/NOT LISTED (closed corner, Munn, etc)
23% Omega
22% Framerica
20% TIE: Arquati, Don Mar
19% TIE: Max, Williamson
17% AMCI
16% TIE: Bella, Bendix, Nelsons, Presto
14% Our own brand/made in-house
12% Gryphon
11% TIE: Picture Woods, Turner
9% TIE: Alumaframe, Art-o-rama, Chop Express, Gemini, Fotiou, Vermont Hardwoods
8% TIE: Indian River, Southwinds, Universal
6% TIE: Bay, CMI, Engelsen, Framers Market CT, Furst Brothers, IVY, New Jersey,
Tracy
5% TIE: APF, Artisan, A Street, Bob Victor's, Burnich, Cabhail, Bravura, Delta,
Design Guild, Genuine GB, Palmetto, Regence, Southern, TC, Valley, Wall, Zinsel
NOTE: This summary only includes the top 95%. For the rest, please see the full
results.
---------
OTHER ITEMS WE CARRY IN OUR SHOPS SURVEY 2/25/04
FRAMING RELATED ITEMS WE CARRY
71% Ready-Made Frames
57% Photo Frames
31% Pre-Cut Mats
29% Frame Restoration
21% Framing Supplies
17% NONE - DOES NOT APPLY
12% Kit Frames
What percentage of your gross does this area take of your annual sales?
19% NONE - DOES NOT APPLY
31% 1%-5%
31% 6%-10%
14% 11%-20%
02% 21%-30%
03% 31%-50%
ART RELATED ITEMS
78% Prints
66% Posters
59% Originals
53% L/E Prints
38% Giclees
33% Original Graphics
16% Sculptures
09% 3D Art
07% NONE - DOES NOT APPLY
05% Animated Cells
What percentage of your gross does this area take of your annual sales?
07% NONE - DOES NOT APPLY
36% 1%-5%
28% 6%-10%
19% 11%-20%
05% 21%-30%
02% 31%-50%
03% 51%-70%
ART MATERIALS
79% NONE - DOES NOT APPLY
21% Matboard
07% Canvas
05% Accessories
05% Brushes & Pens
05% Paints
05% Supplies
What percentage of your gross does this area take of your annual sales?
81% NONE - DOES NOT APPLY
14% 1%-5%
02% 6%-10%
03% 31%-50%
PHOTO
91% NONE - DOES NOT APPLY
07% Portraits
07% Processing
05% Cameras and/or Film
02% Self Service Digital Machine
What percentage of your gross does this area take of your annual sales?
90% NONE - DOES NOT APPLY
02% 1%-5%
02% 21%-30%
02% 31%-50%
02% 51%-70%
02% 71%+
NEEDLE ART
95% NONE - DOES NOT APPLY
03% Counted Thread (cross stitch)
03% Supplies
02% Accessories
02% Crewel
02% Kits
02% Surface Embroidery
What percentage of your gross does this area take of your annual sales?
95% NONE - DOES NOT APPLY
03% 1%-5%
02% 11%-20%
GENERAL GIFTS
43% NONE - DOES NOT APPLY
36% Home Decor
28% Jewelry
21% Collectibles
19% Clocks
17% Books
17% Lamps
14% Xmas
12% Furniture
10% Plush
09% Pillows
05% Toys
What percentage of your gross does this area take of your annual sales?
43% NONE - DOES NOT APPLY
31% 1%-5%
12% 6%-10%
09% 11%-20%
03% 21%-30%
02% 31%-50%
OTHER
34% NONE - DOES NOT APPLY
34% SOMETHING WE FORGOT TO INCLUDE
31% Cards
05% Caligraphy Service
03% Scrapbooking
02% Caning
What percentage of your gross does this area take of your annual sales?
40% NONE - DOES NOT APPLY
41% 1%-5%
16% 6%-10%
02% 11%-20%
02% 31%-50%
What percentage do ALL OF THE ABOVE combined represent in the big picture?
05% NONE - DOES NOT APPLY
12% 1%-5%
17% 6%-10%
22% 11%-20%
17% 21%-30%
12% 31%-50%
07% 51%-70%
07% 71%+
---------
2003 TECHNOLOGY SURVEY:
Combined with other years. See 12/2006 above.